Every screen below comes from plain Python data models — VeloIQ generates the React front-end automatically. Tables, galleries, crosstabs, trees, master-detail panels, forms, and analytics, in light and dark mode, with zero boilerplate.
An assembled overview and instant navigation — generated from your models, not hand-wired.

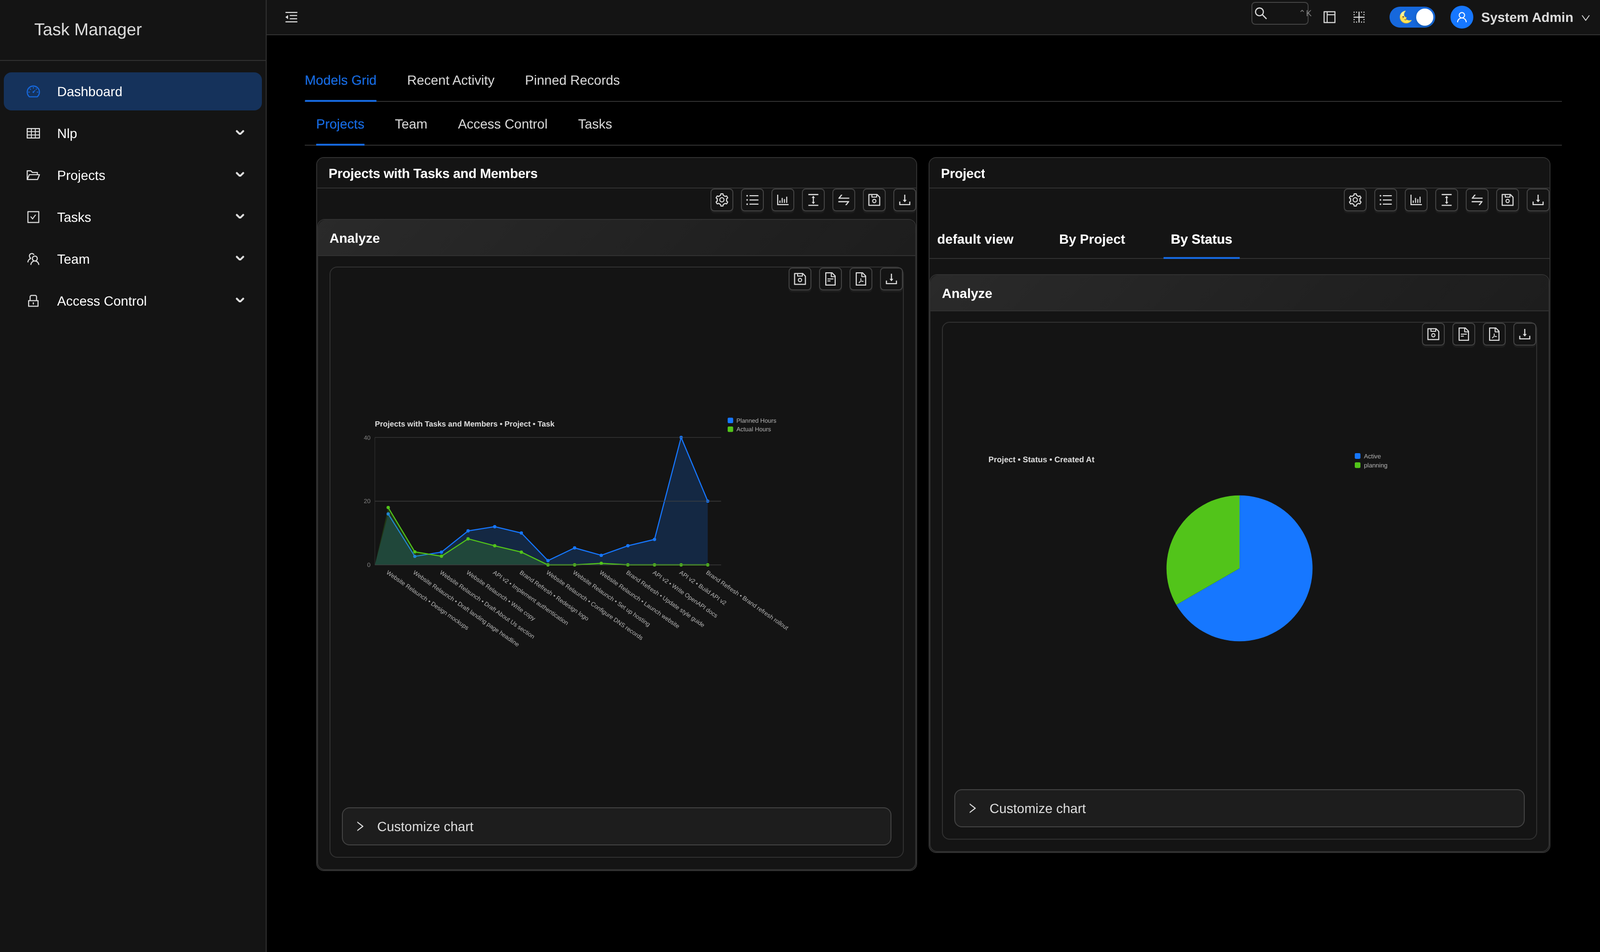
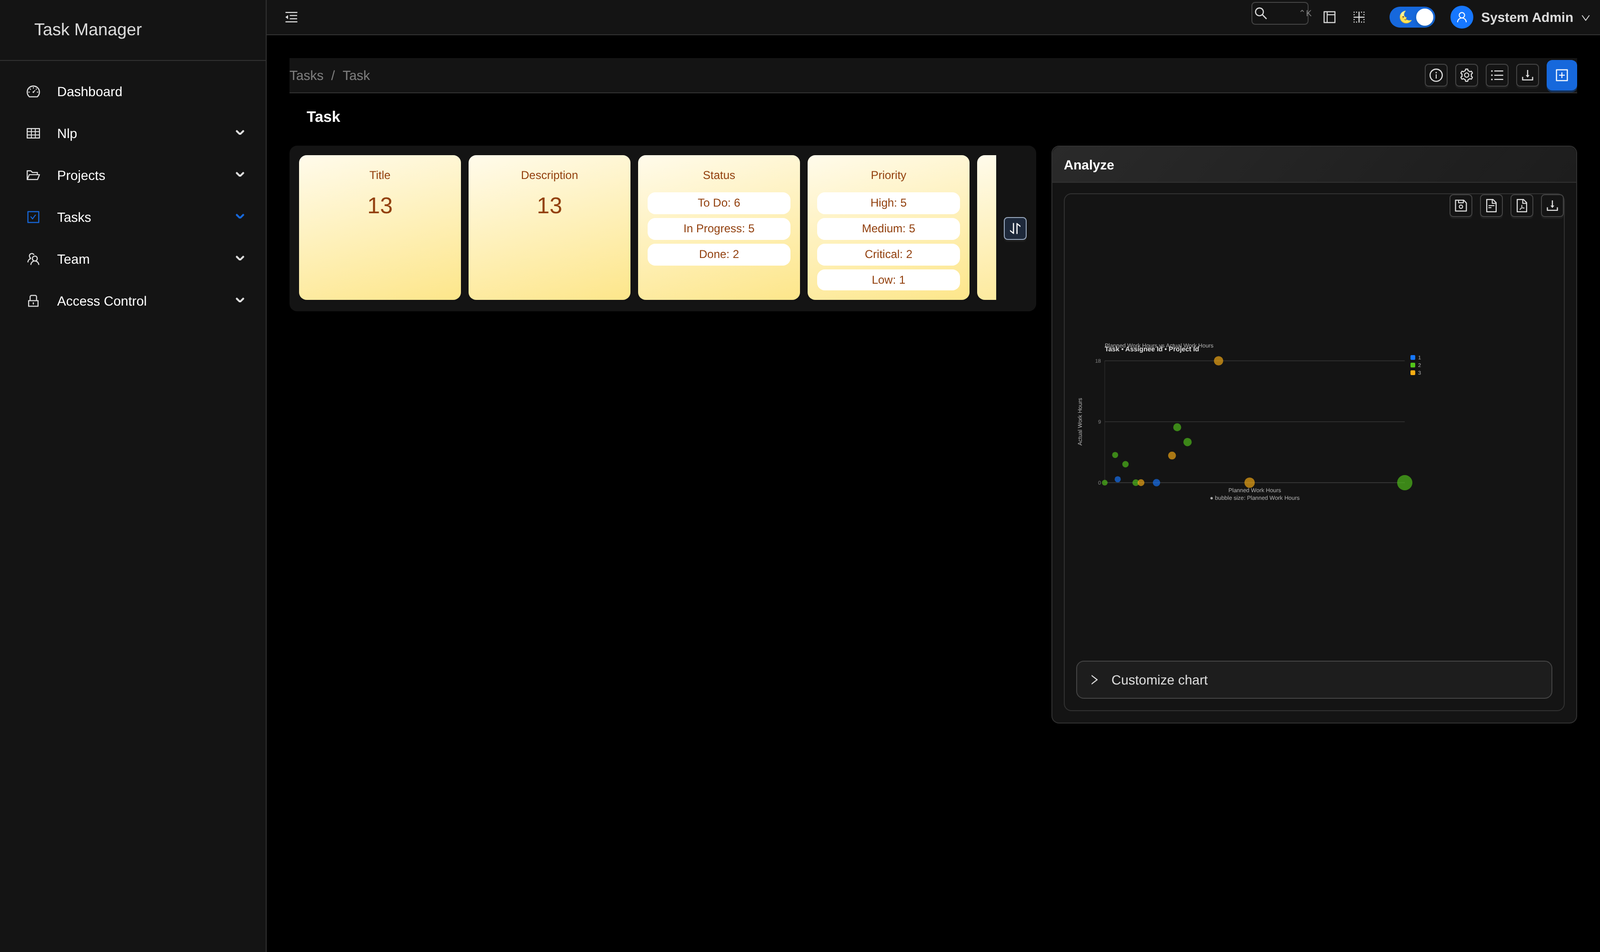
Configurable cards combine live charts, recent activity, and pinned records — drop in a model and it appears. No front-end code, no chart library to wire up.

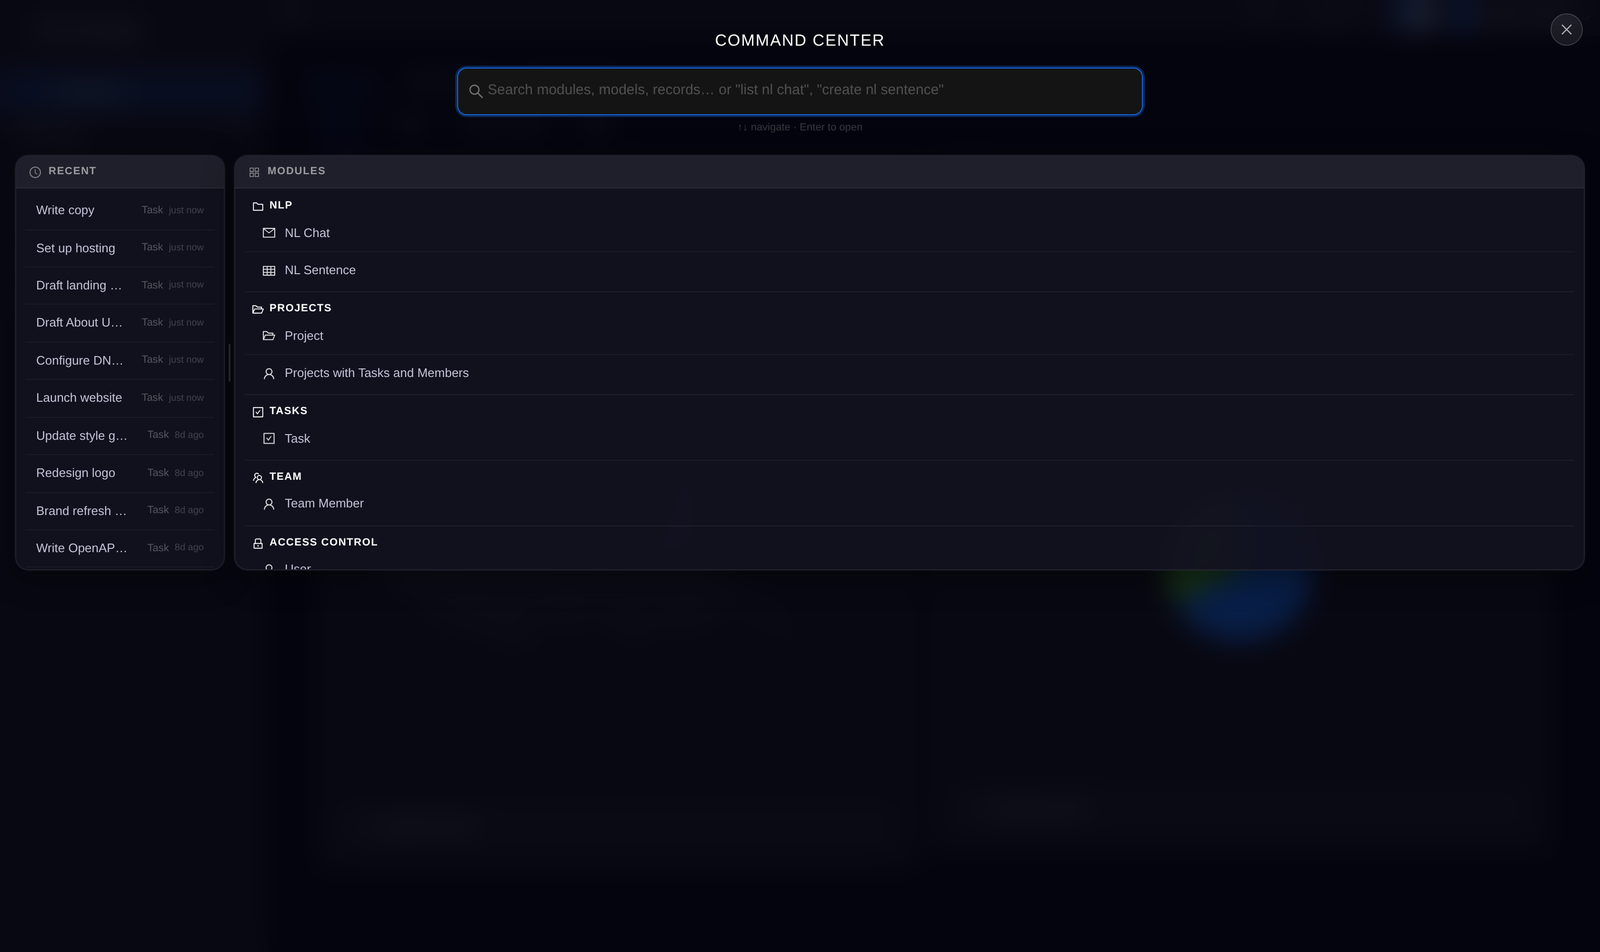
A full-screen palette to jump straight to any module, model, or record. Search-driven navigation your users will expect — included by default.
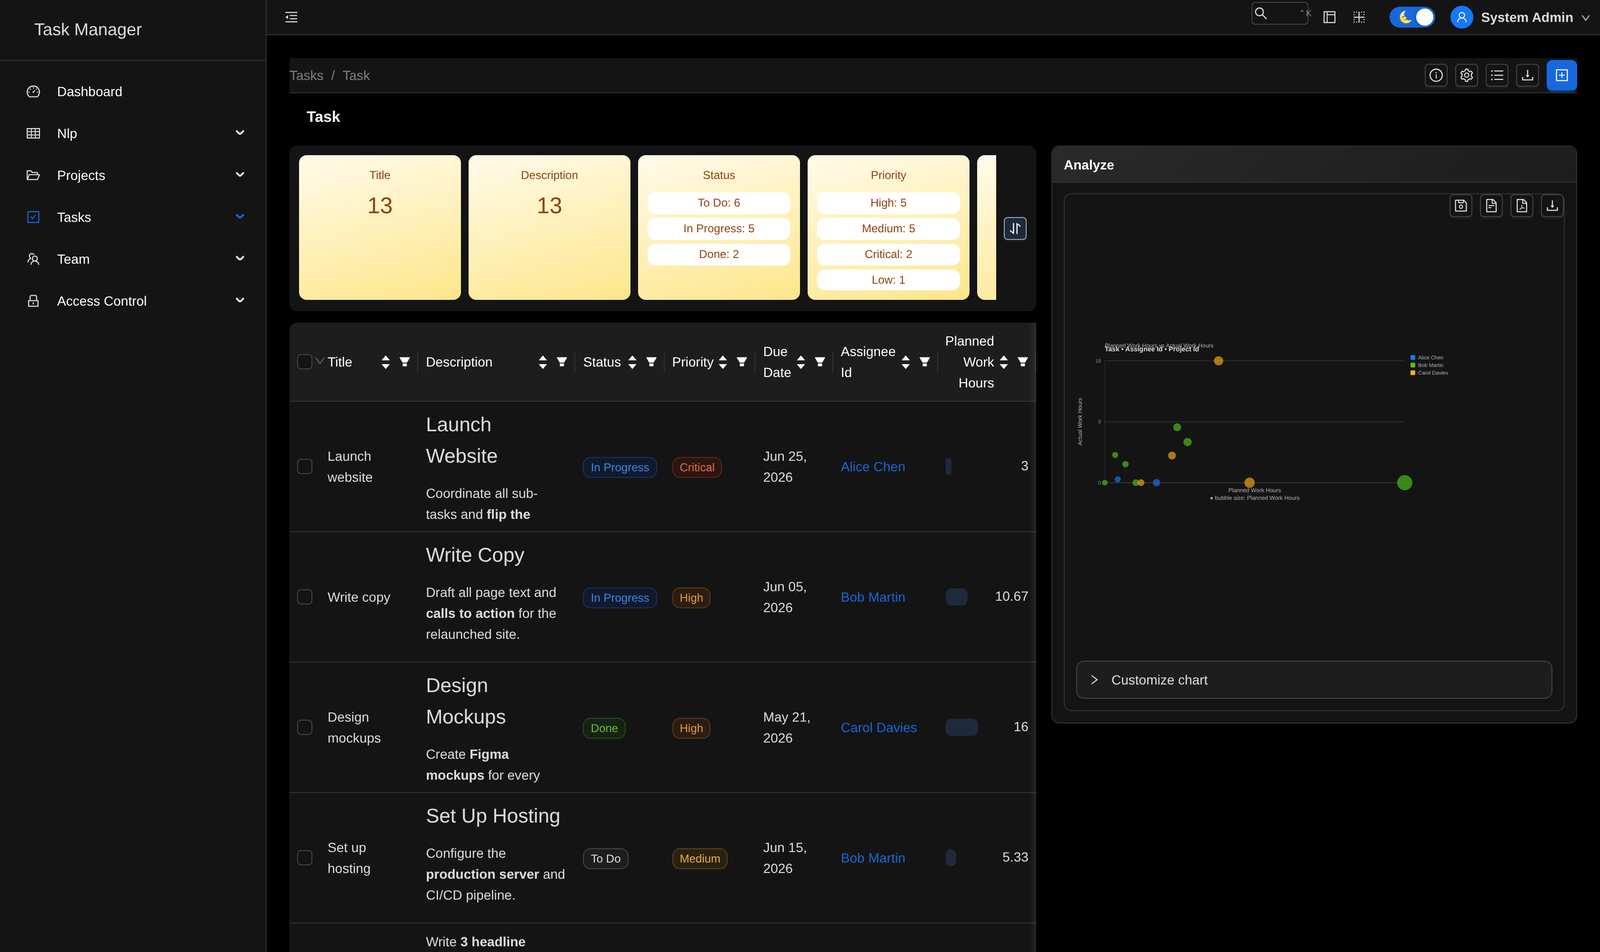
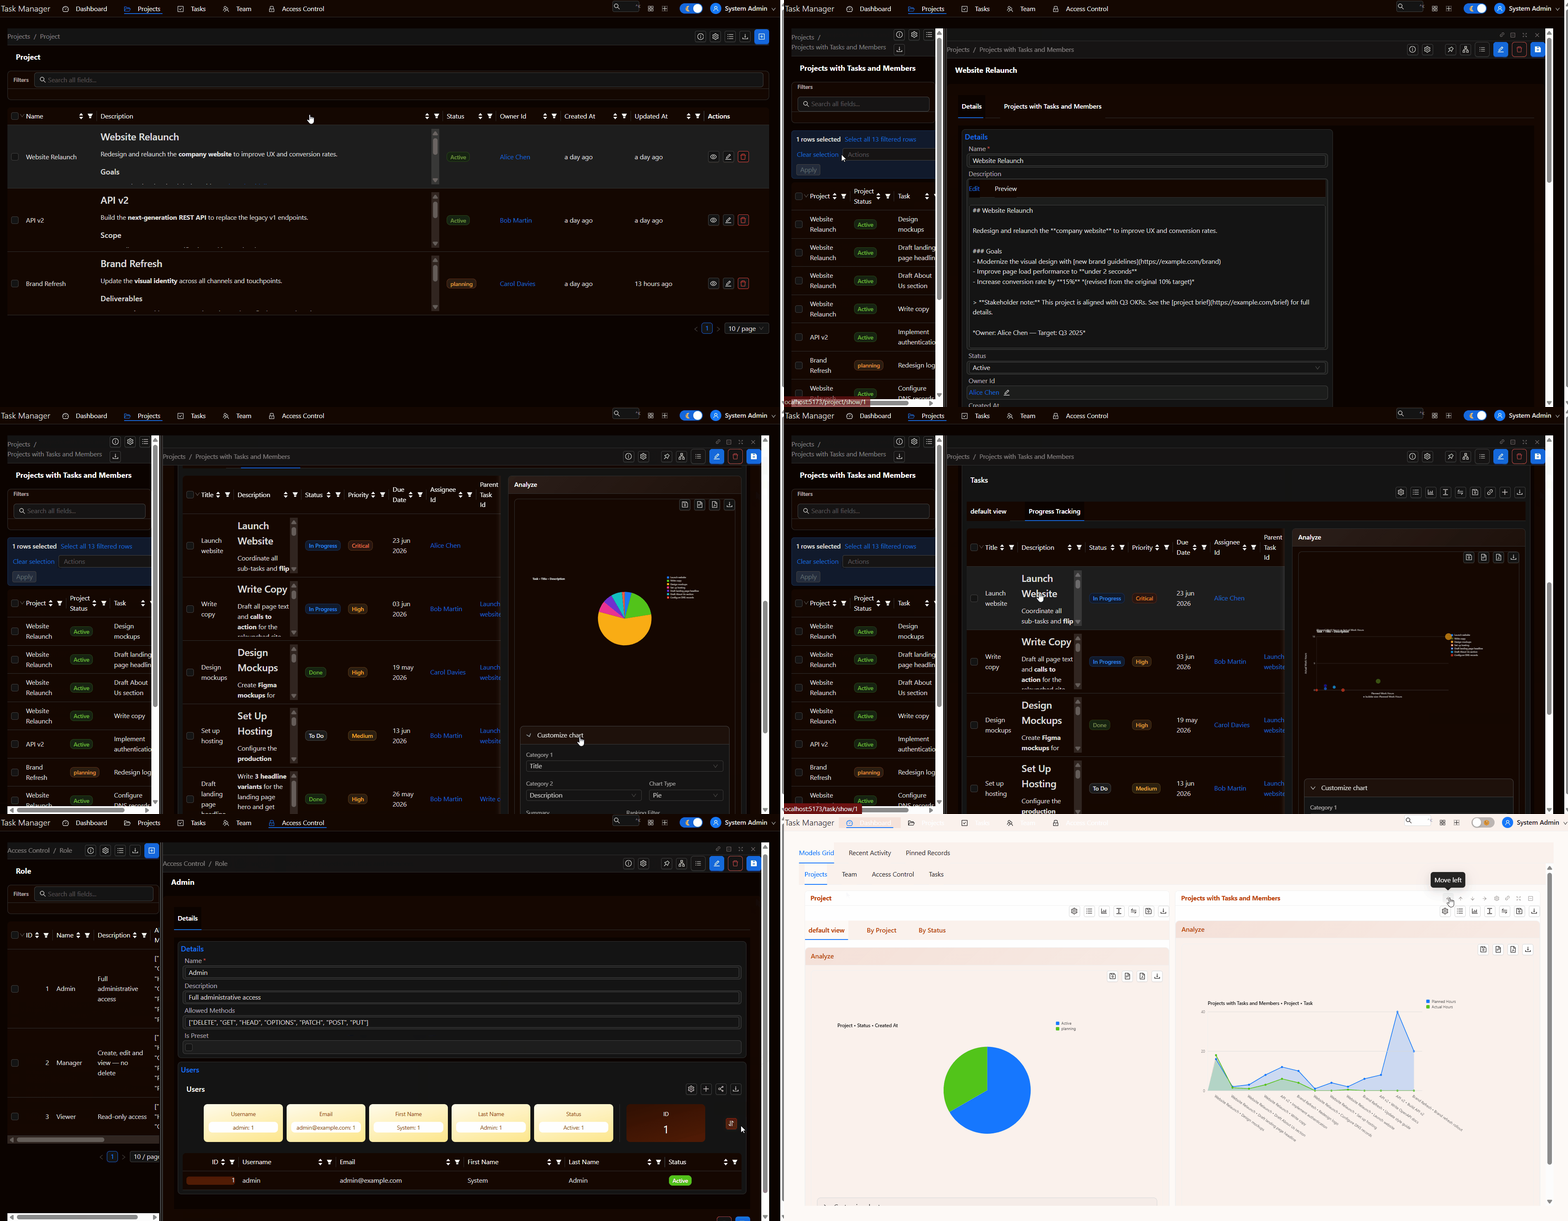
The same data, shown the way each team needs it — switch the view, no rebuild required.

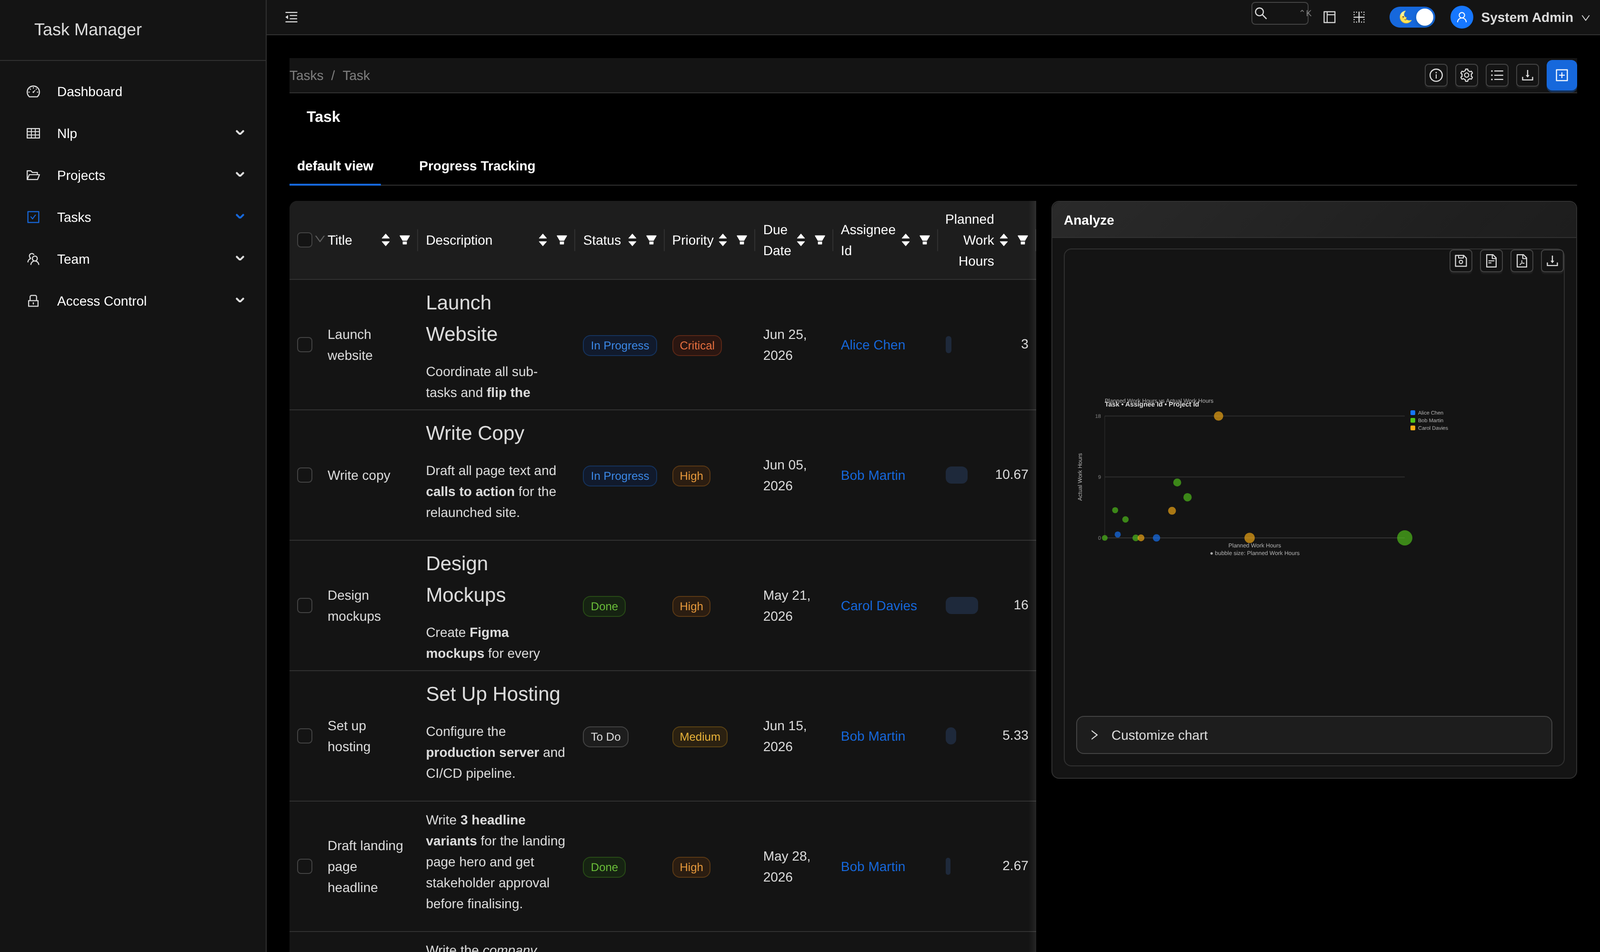
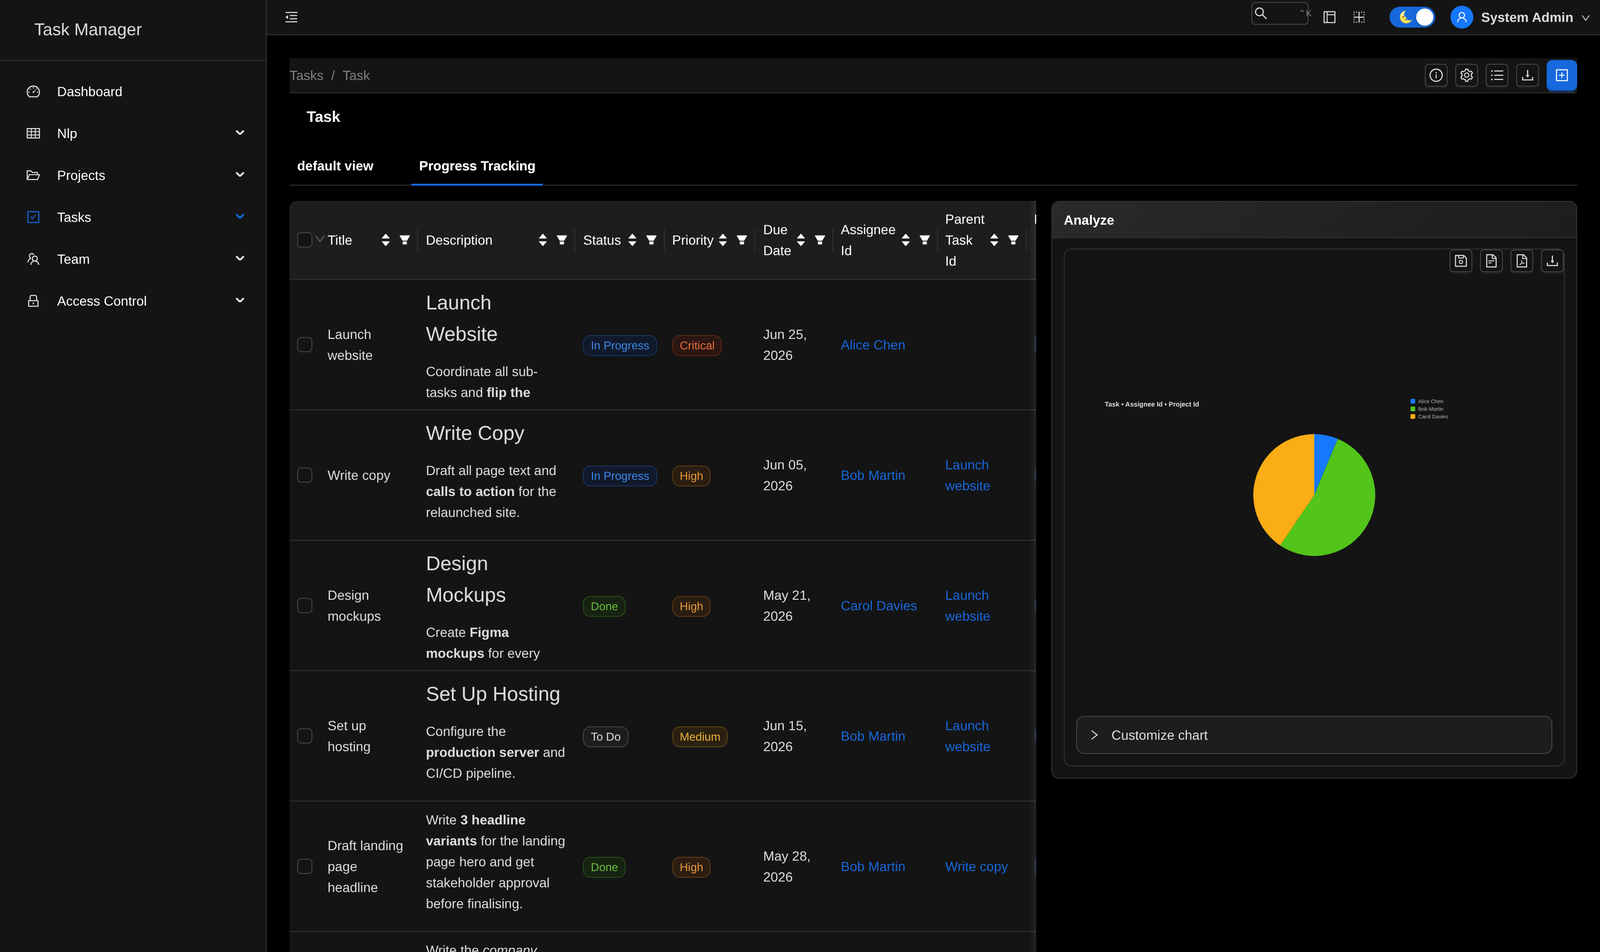
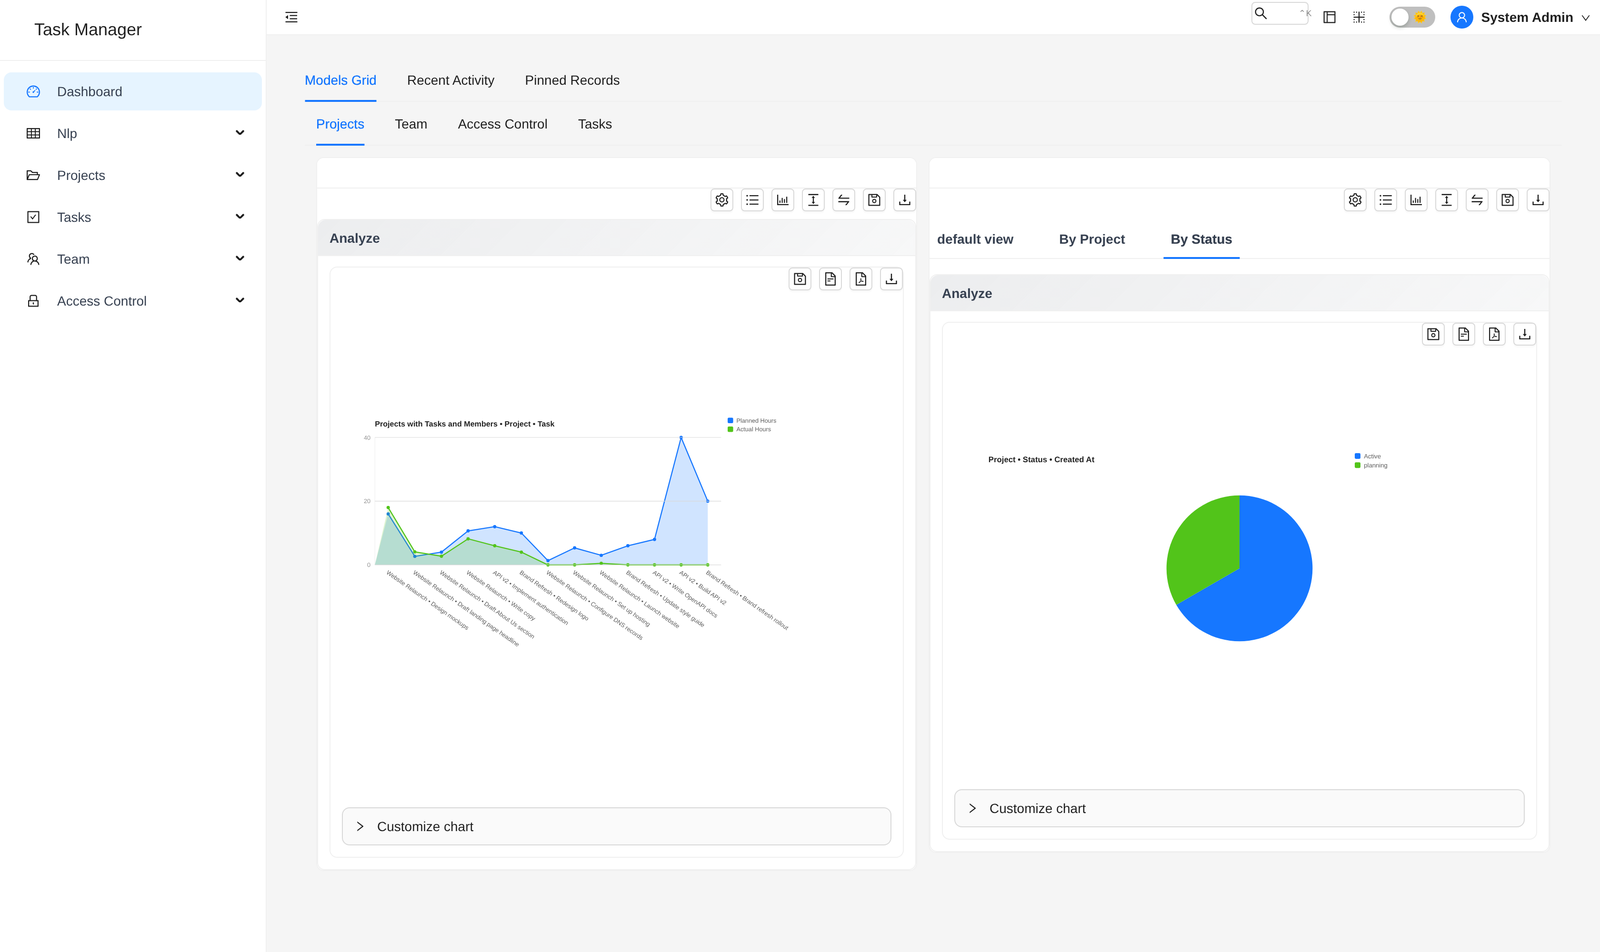
Sortable columns, inline filters, colored status tags, and a live analysis chart sitting right beside the data.

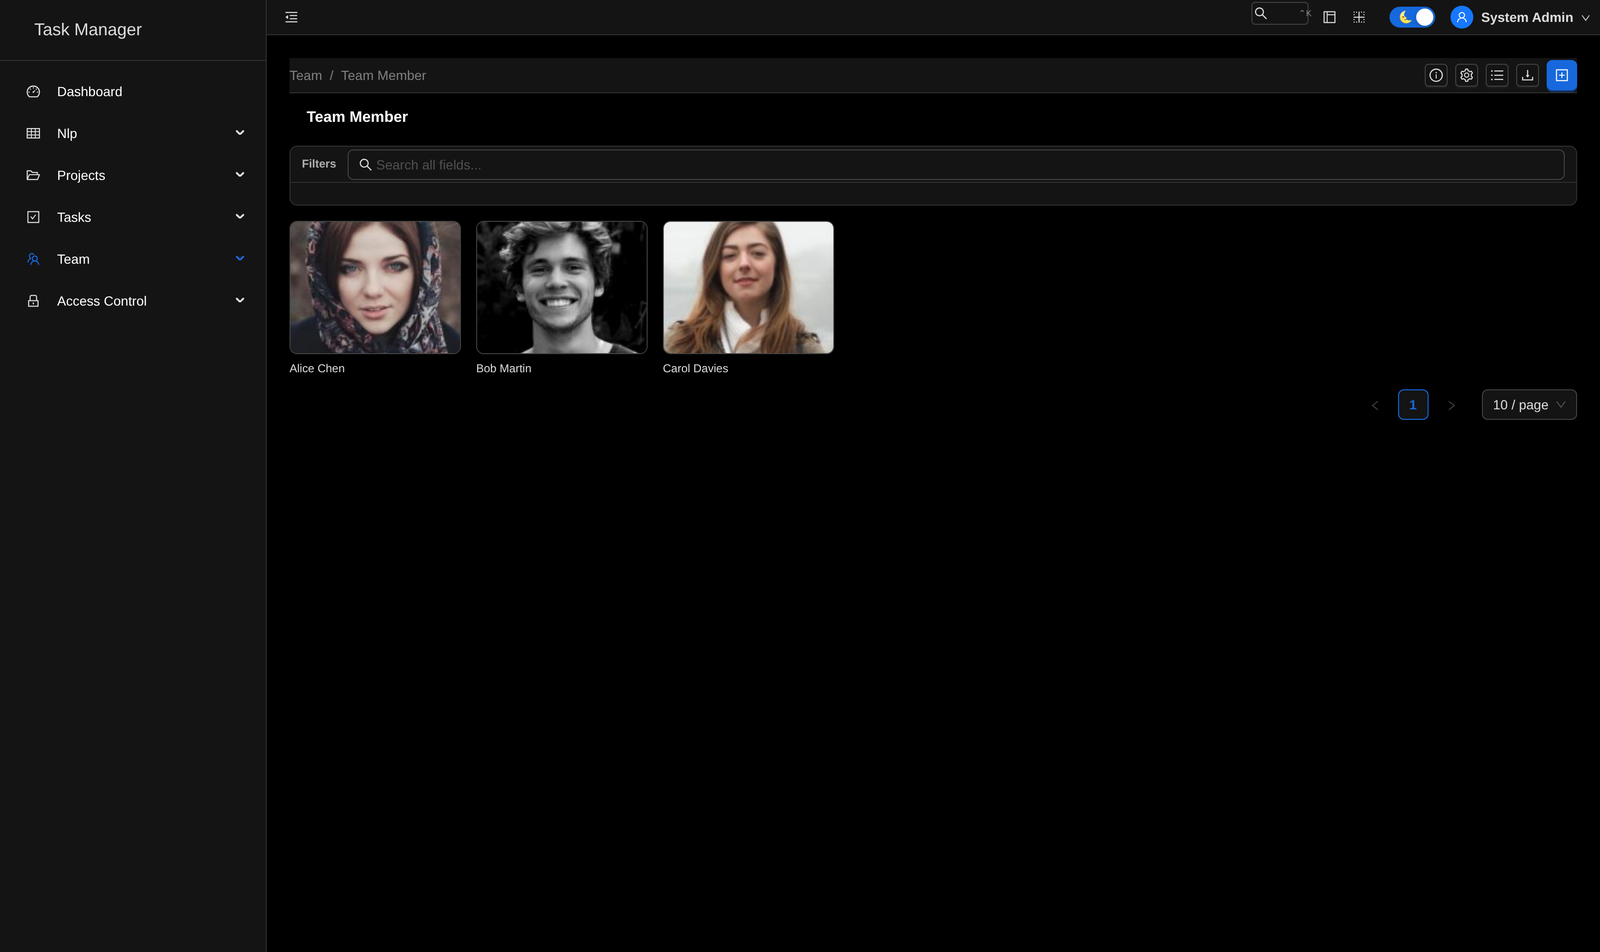
A visual card layout that's perfect for team members, products, or anything with an image — switchable per model.

Counts and distributions across every column — an instant summary of any dataset, no spreadsheet export.

Flip a switch to reveal the underlying records beneath the roll-up — drill down without losing the big picture.

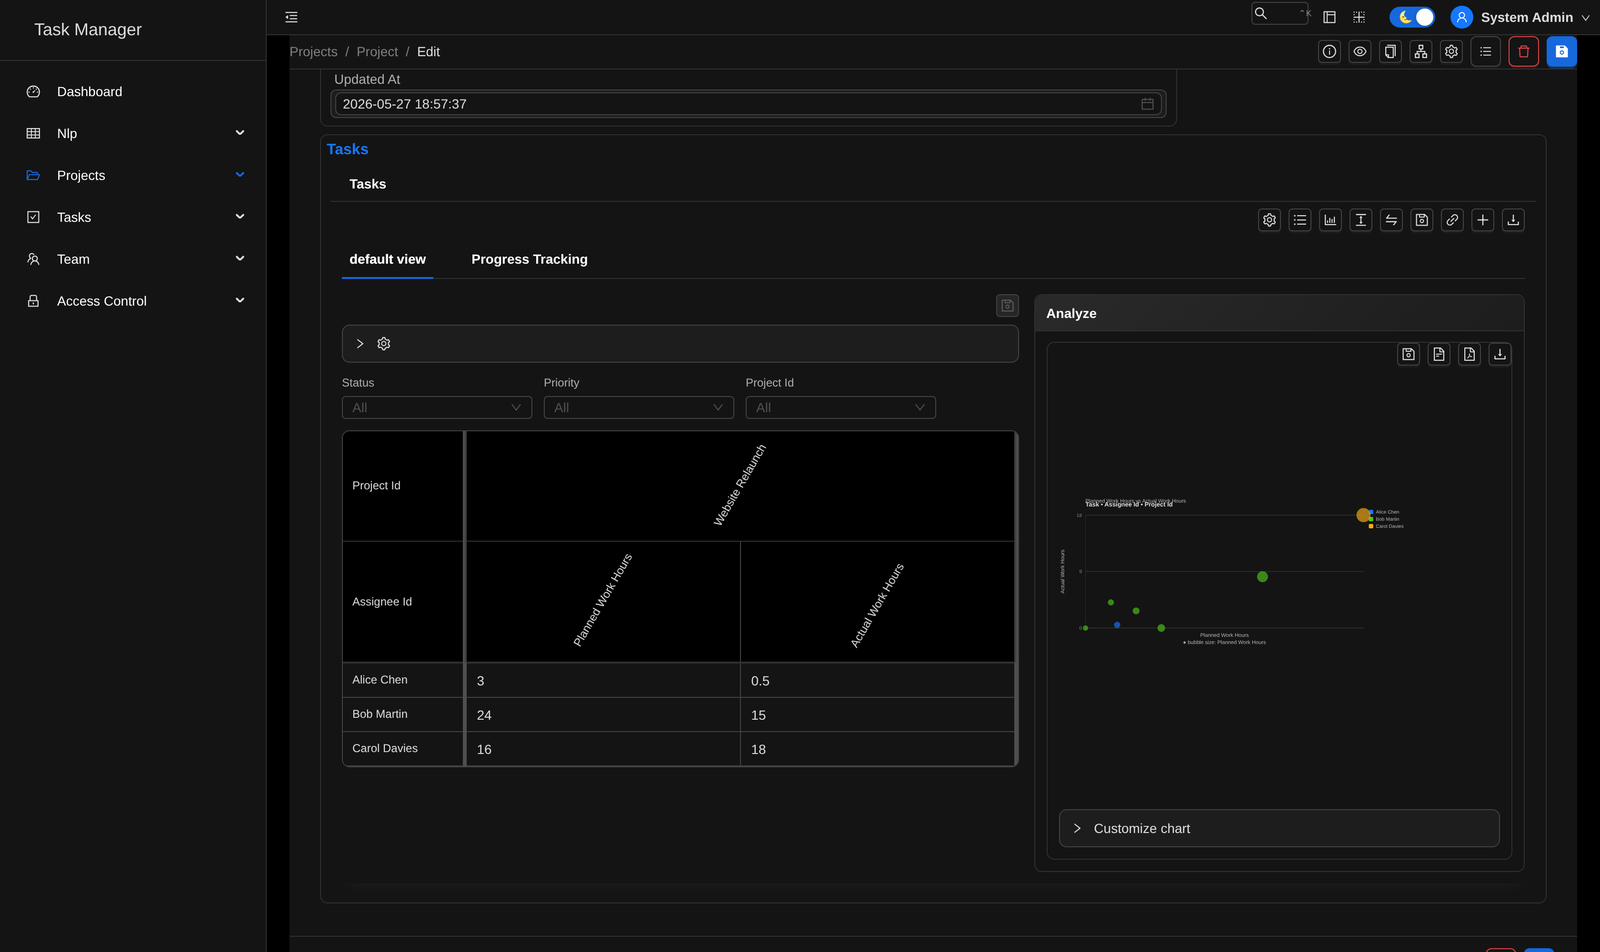
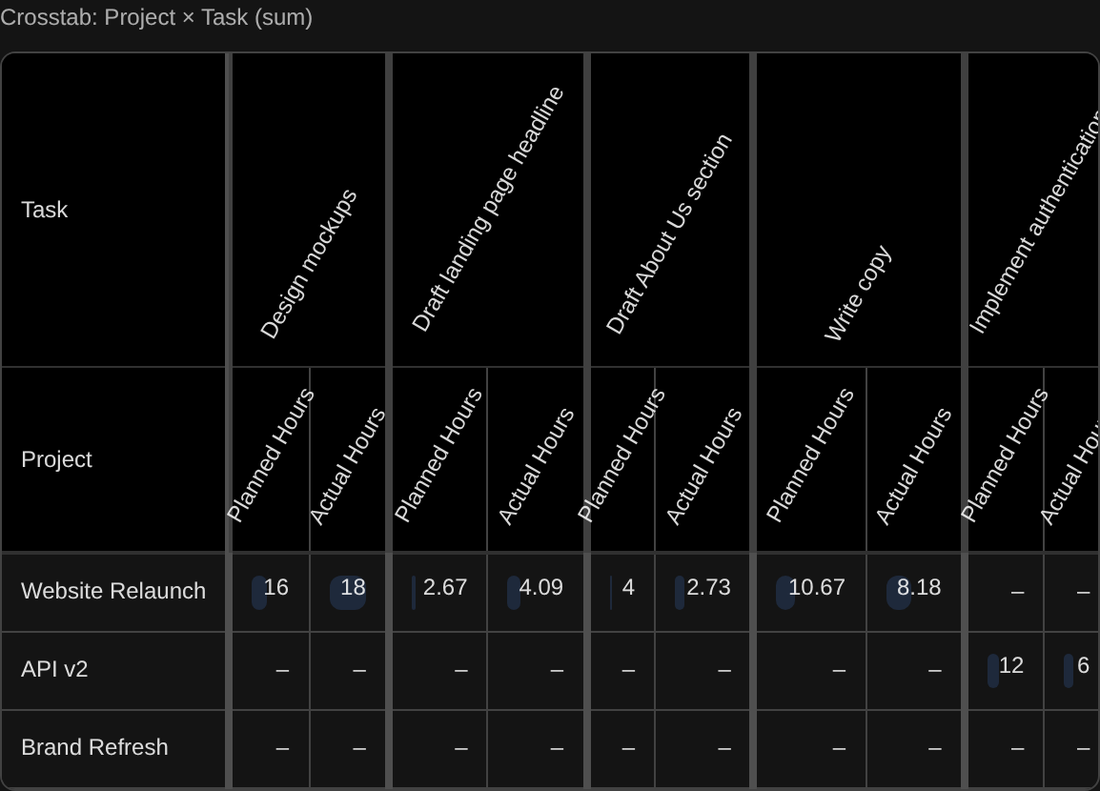
Cross-tabulate related records by any two dimensions — even inline inside an edit form. No SQL, no BI tool.

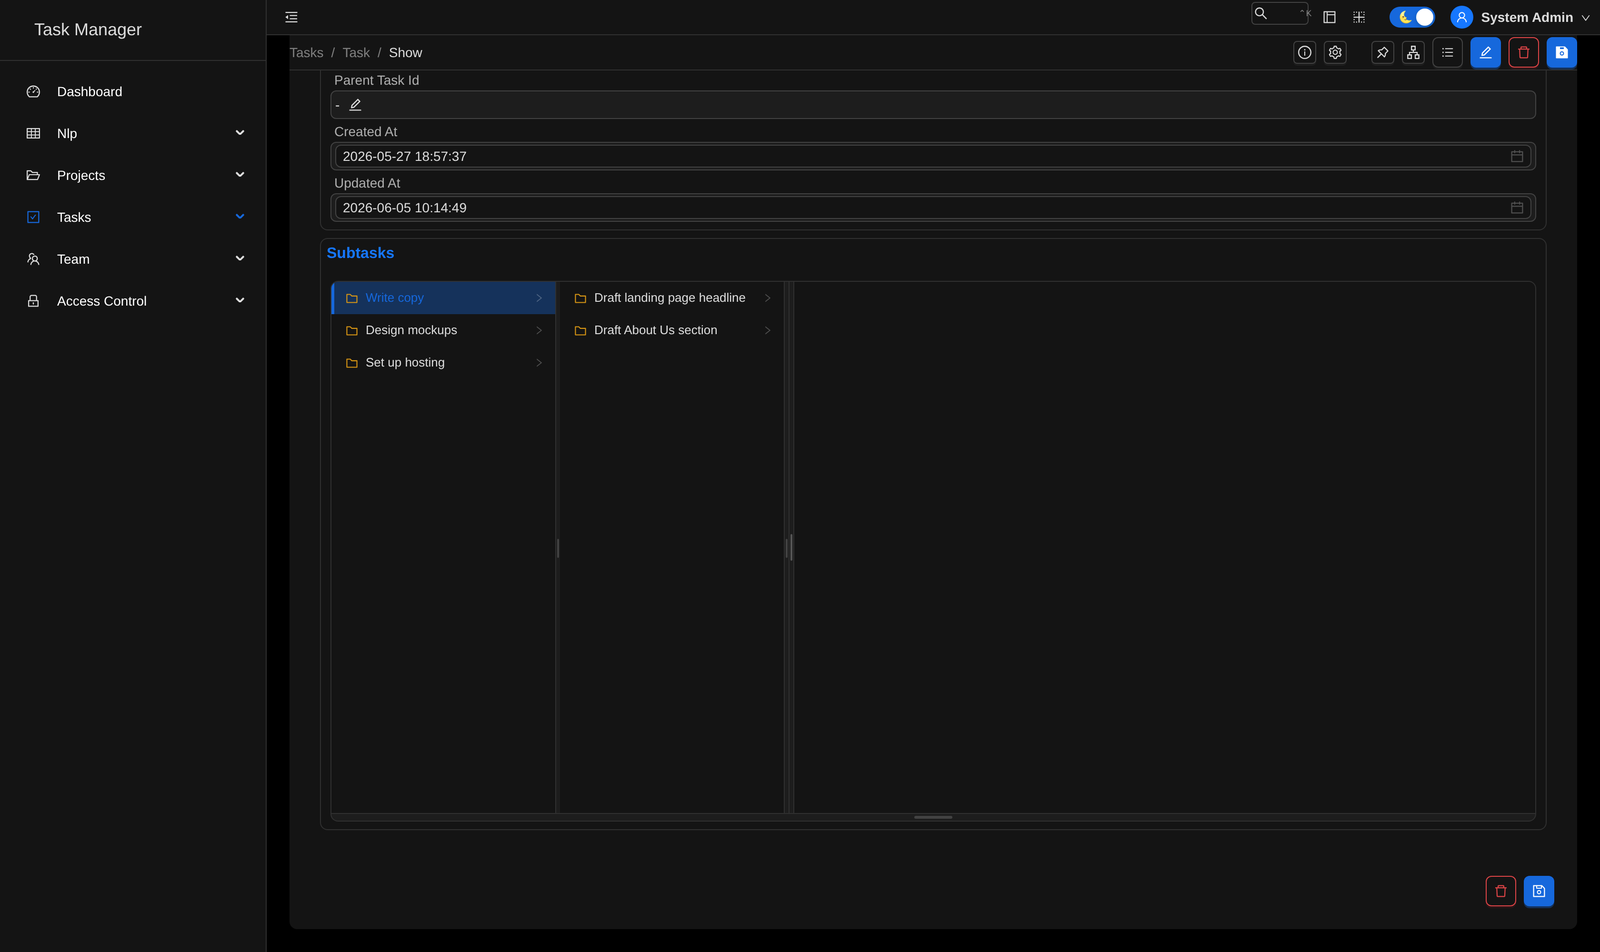
Self-referential relationships are auto-detected and rendered as a column-by-column tree — drill from parent to child to leaf.

Each model can keep multiple saved views — different columns, filters, view type, and chart — so every role gets the layout that fits them.
Inspect records side by side and edit them through forms derived straight from your schema.

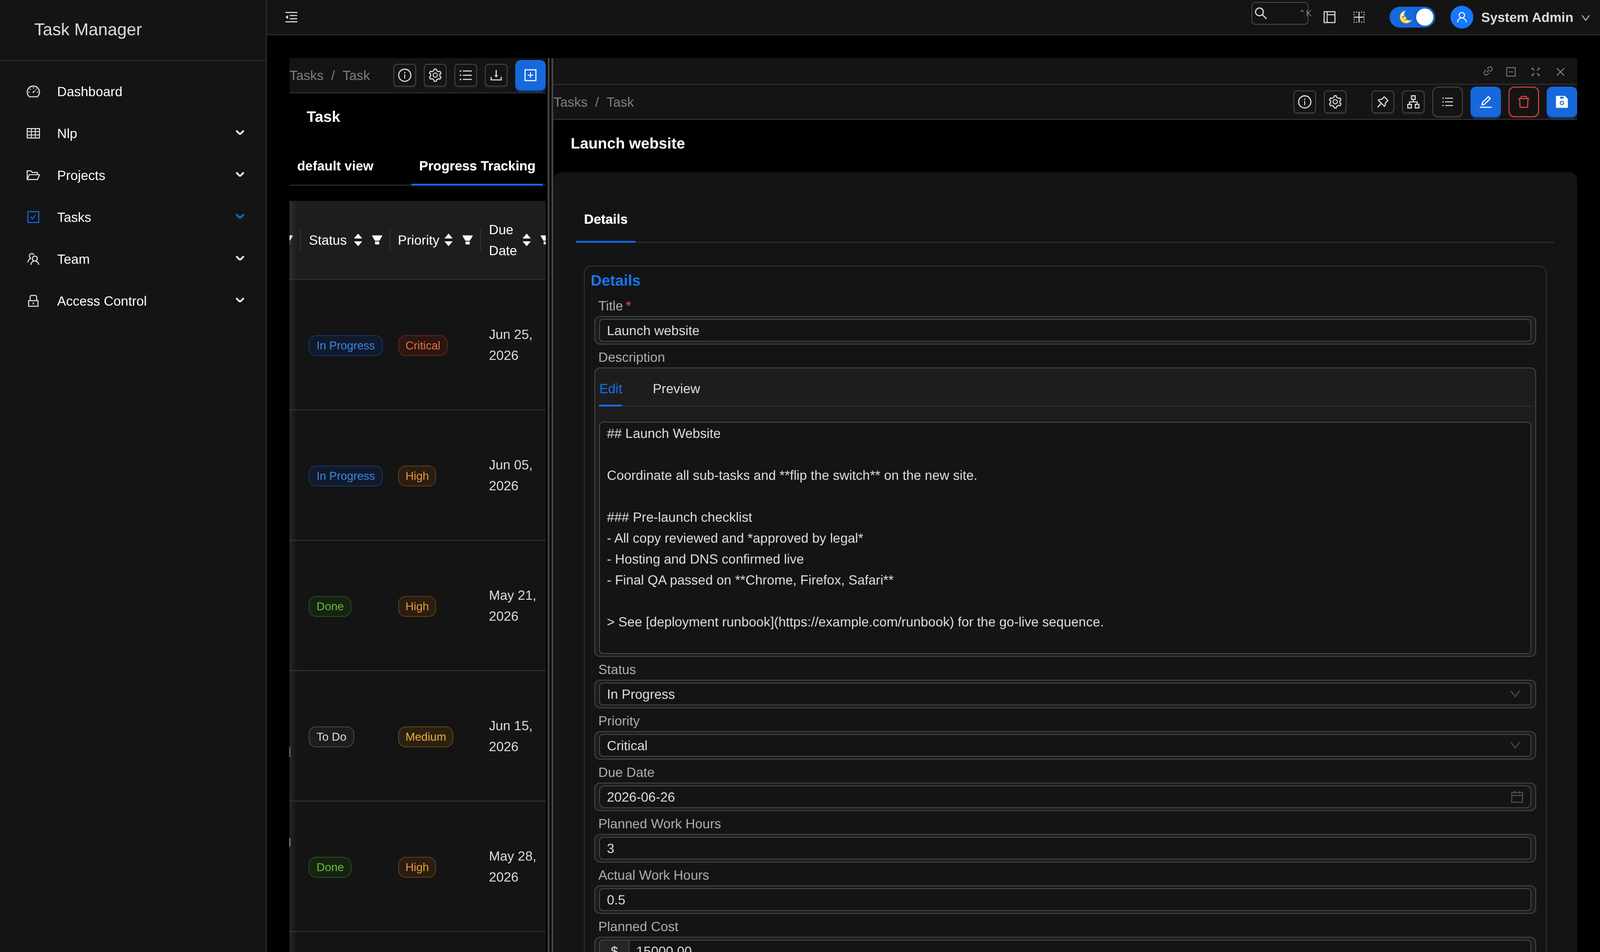
Click a row to open a detail panel beside the list. Resize it, maximize it, or pop it out to a full page.

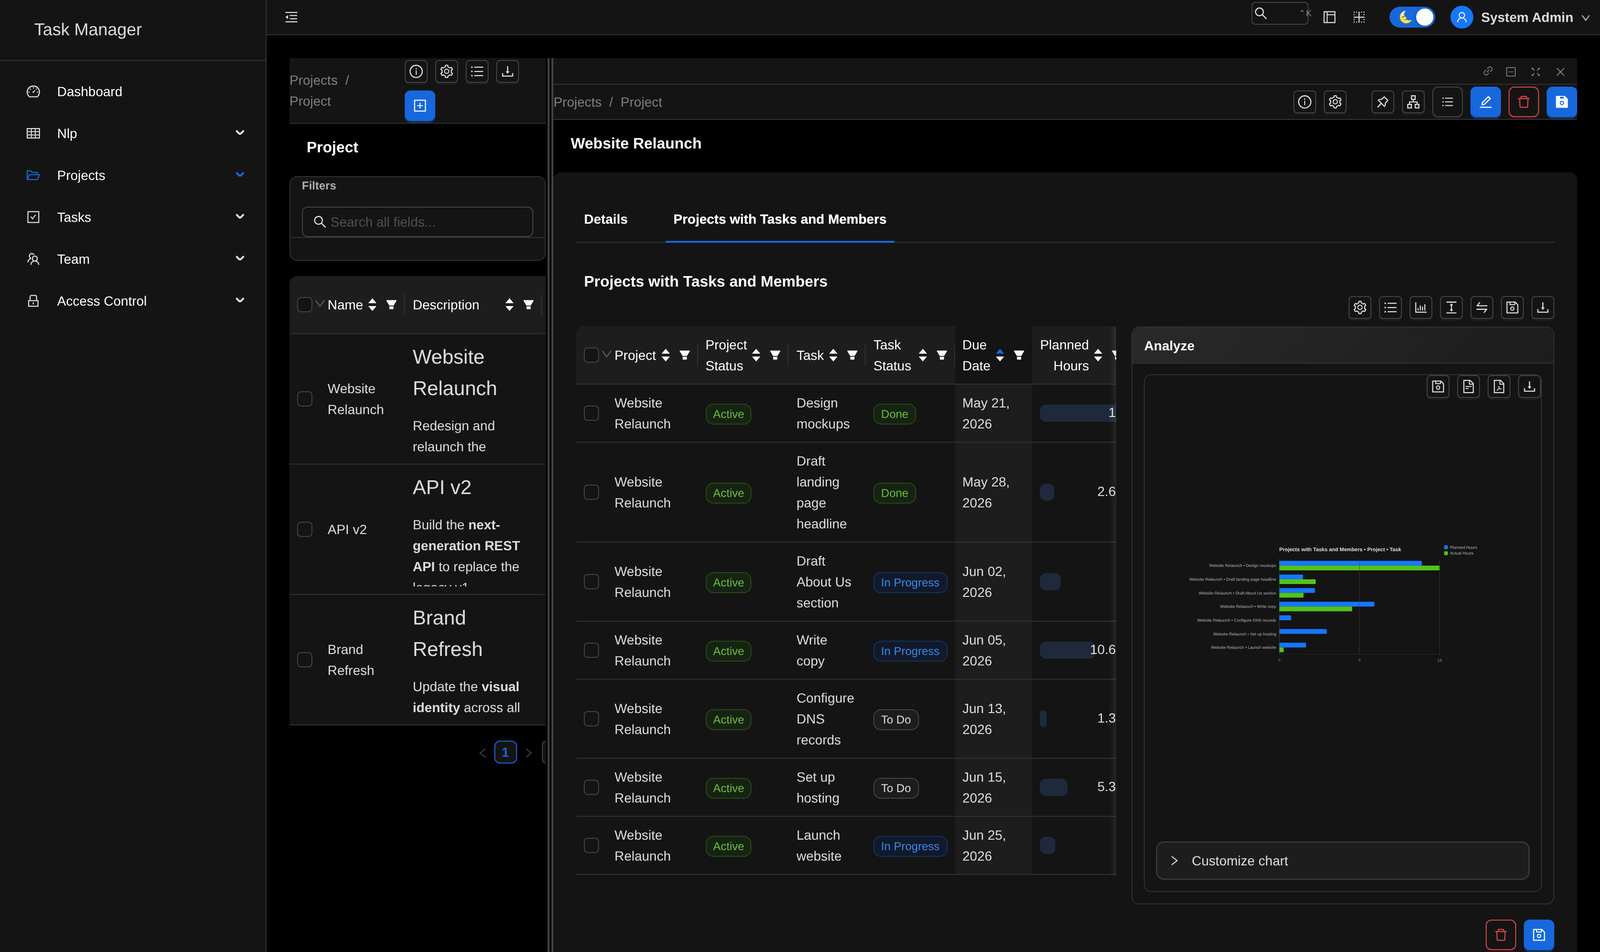
Related records render right inside the record — each with its own view type, filters, and analysis chart.

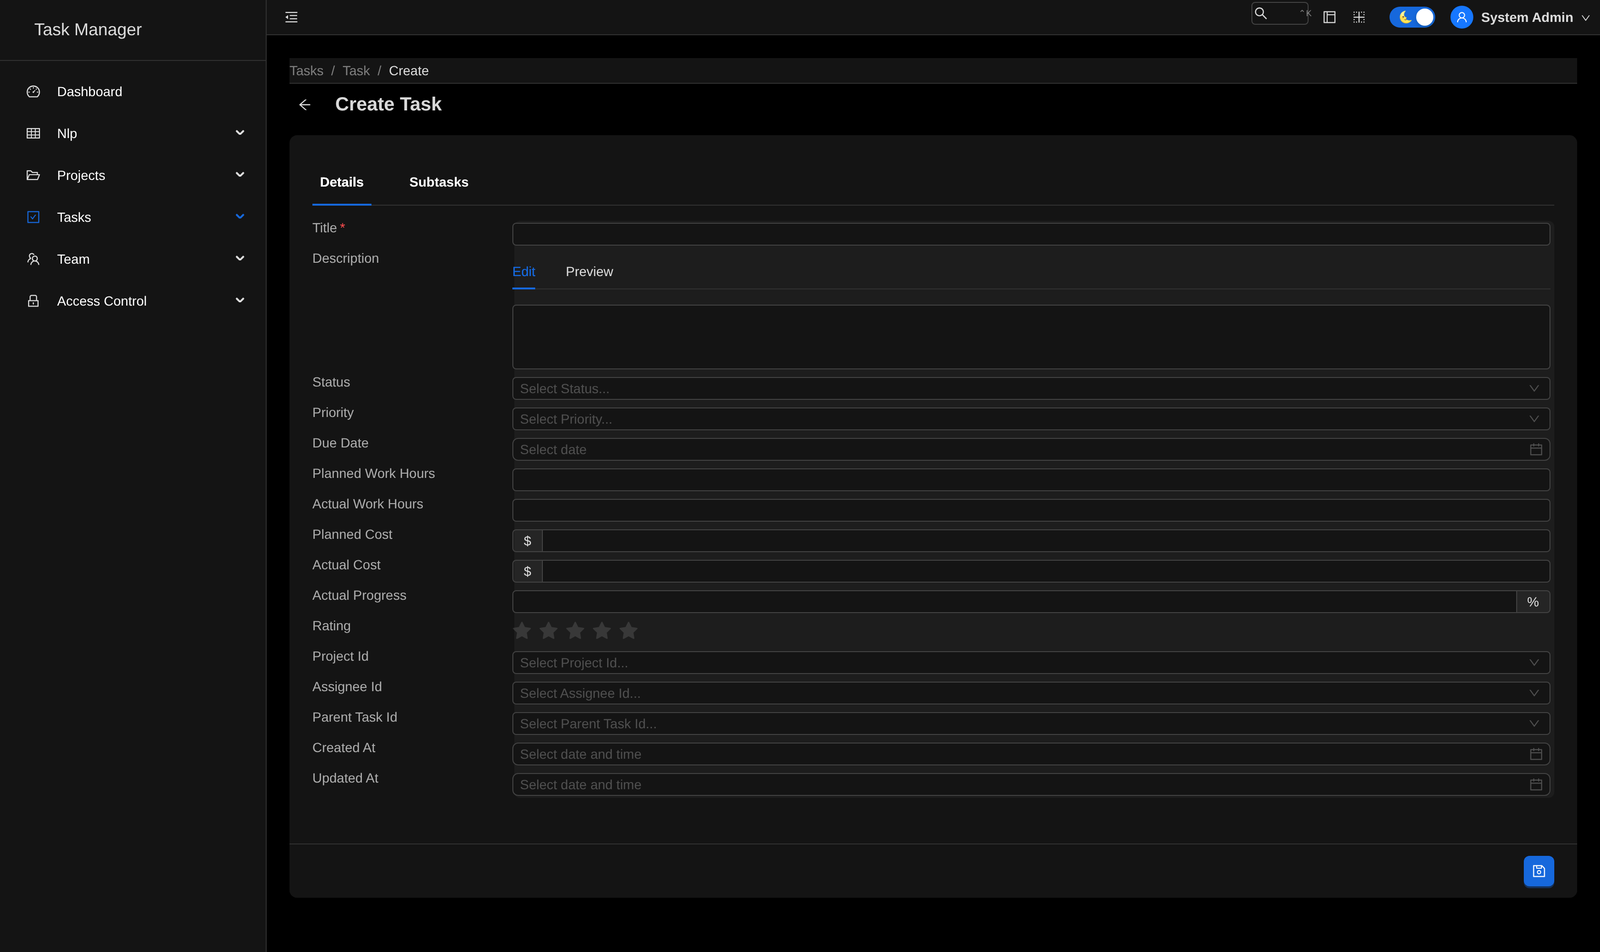
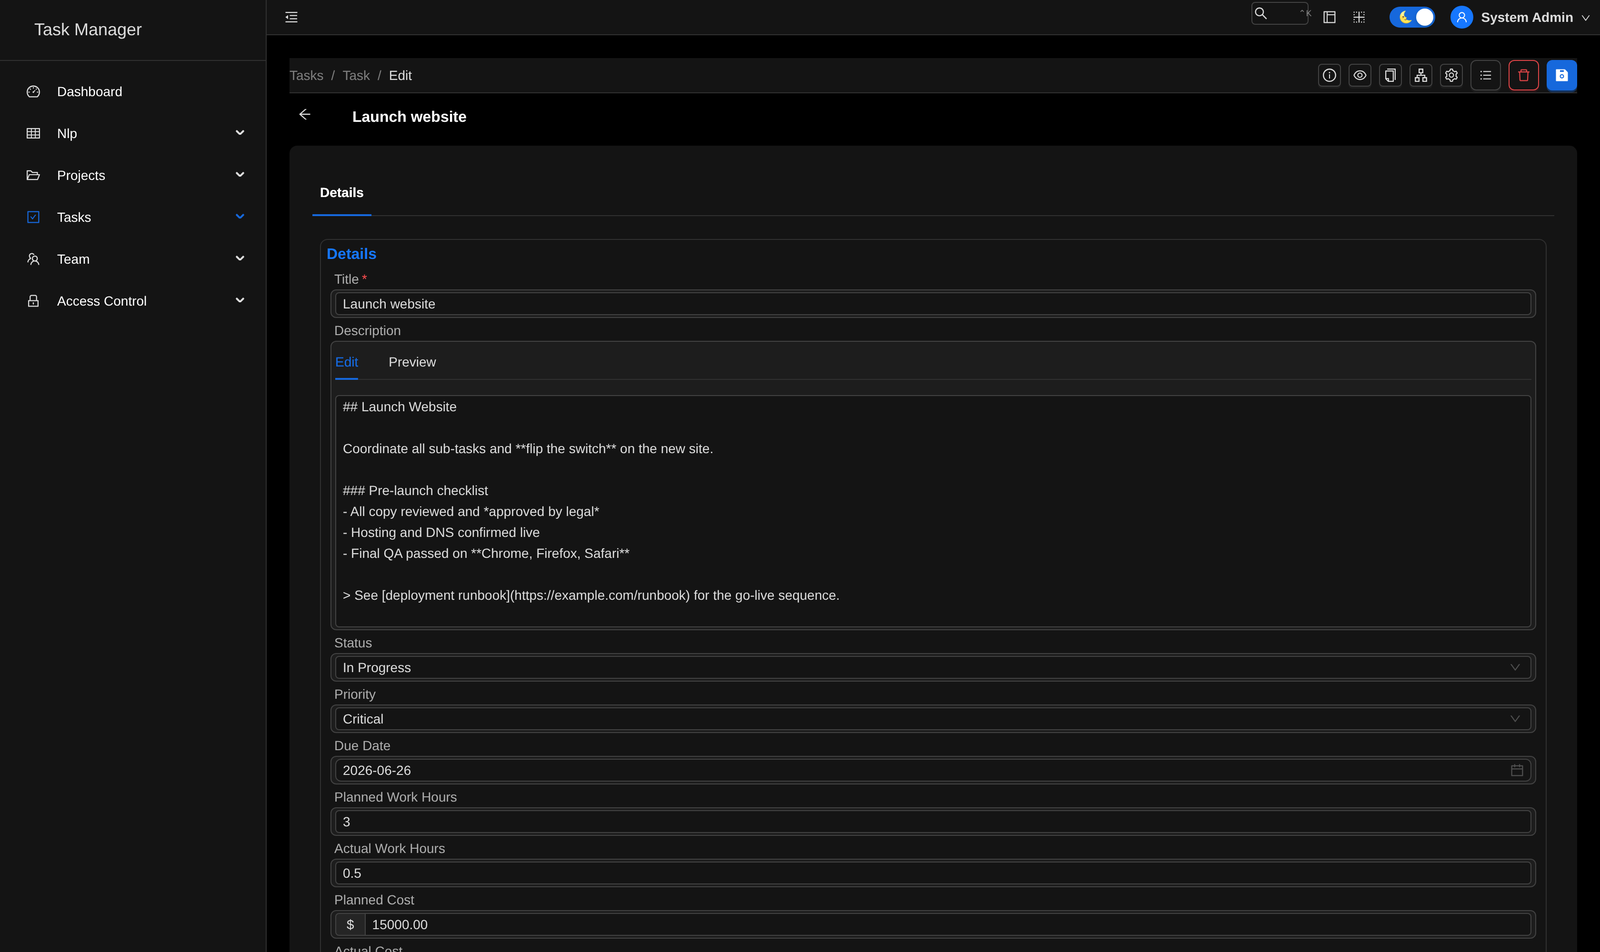
Markdown editors, star ratings, currency, dates, and relation pickers — every input inferred from your model fields.

Create and edit share one definition, with validation and relation handling built in. Change a model, the forms follow.
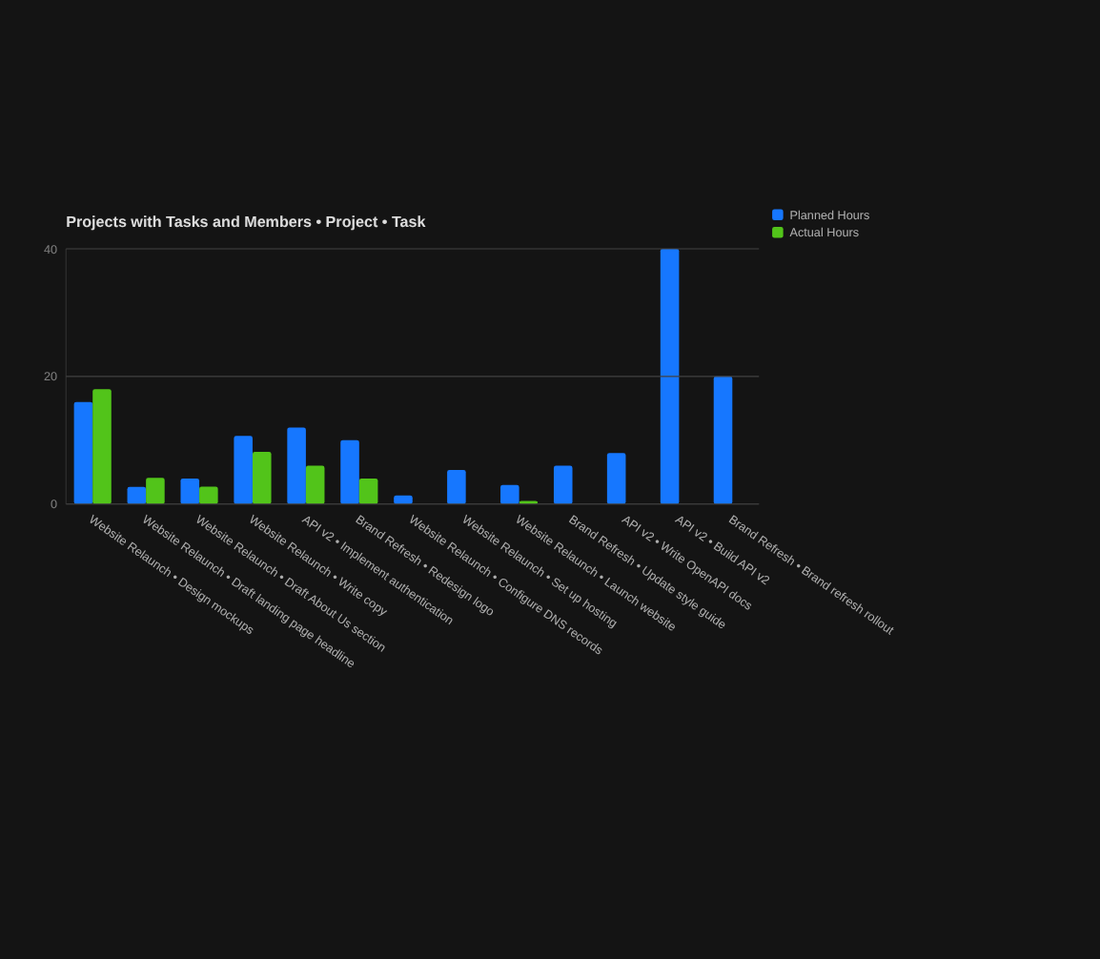
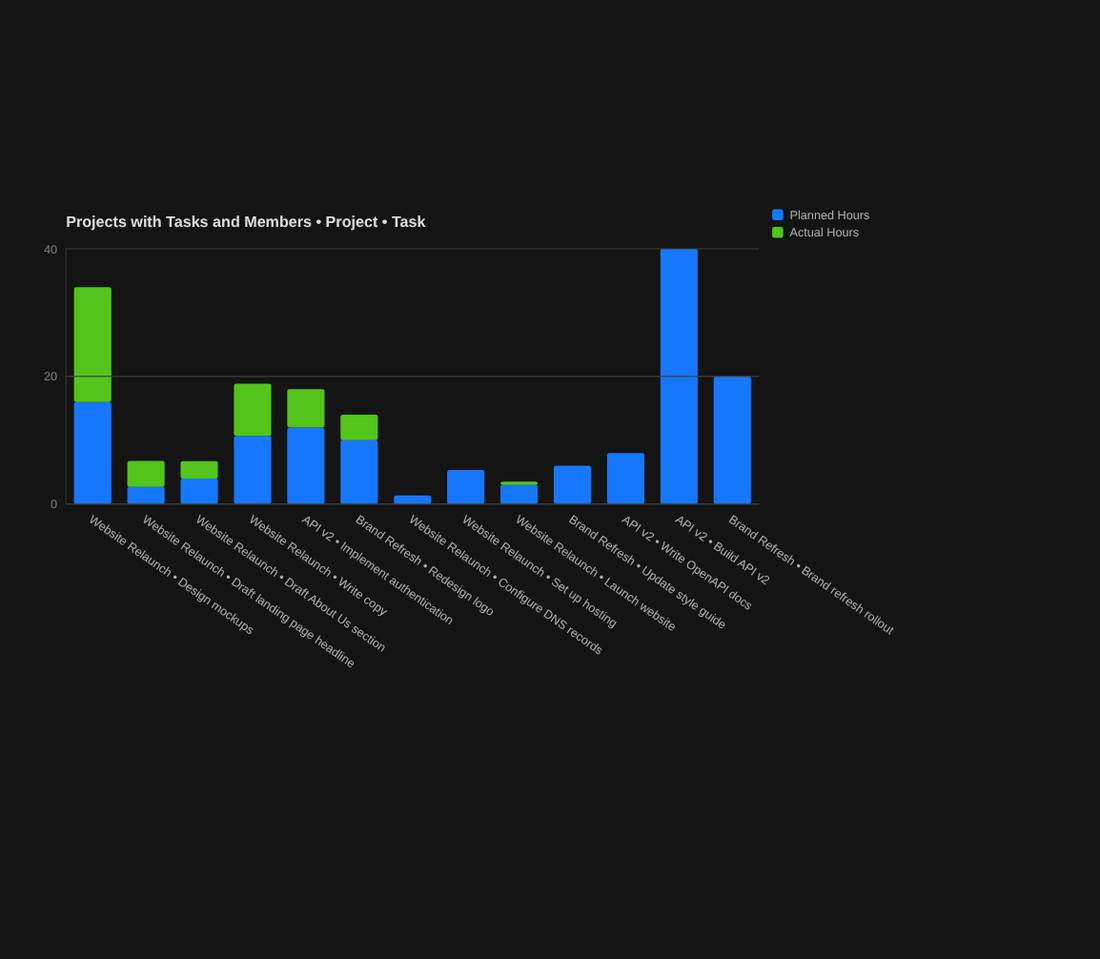
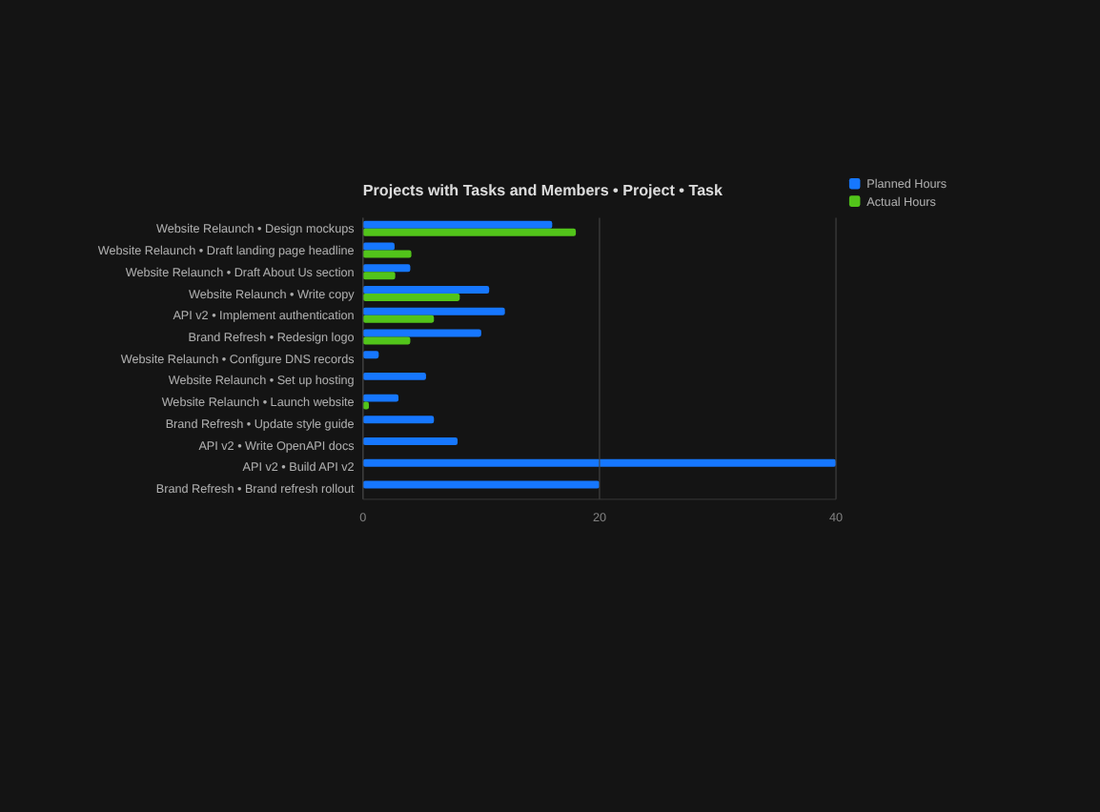
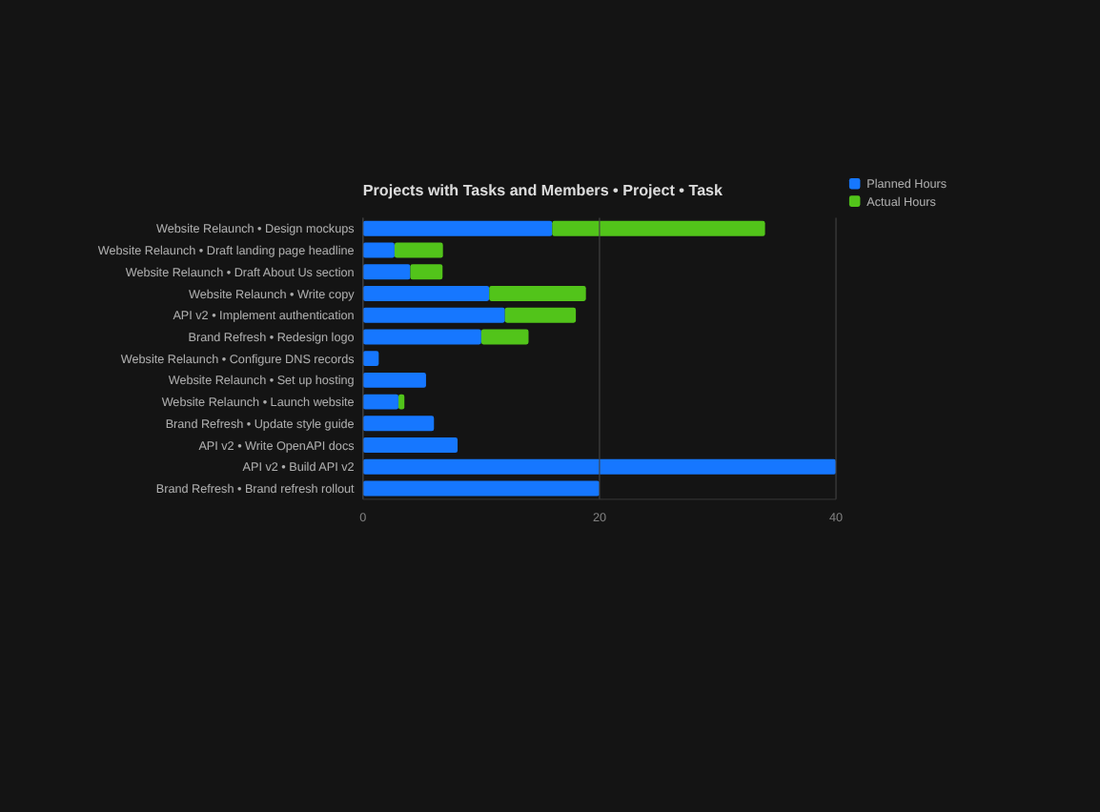
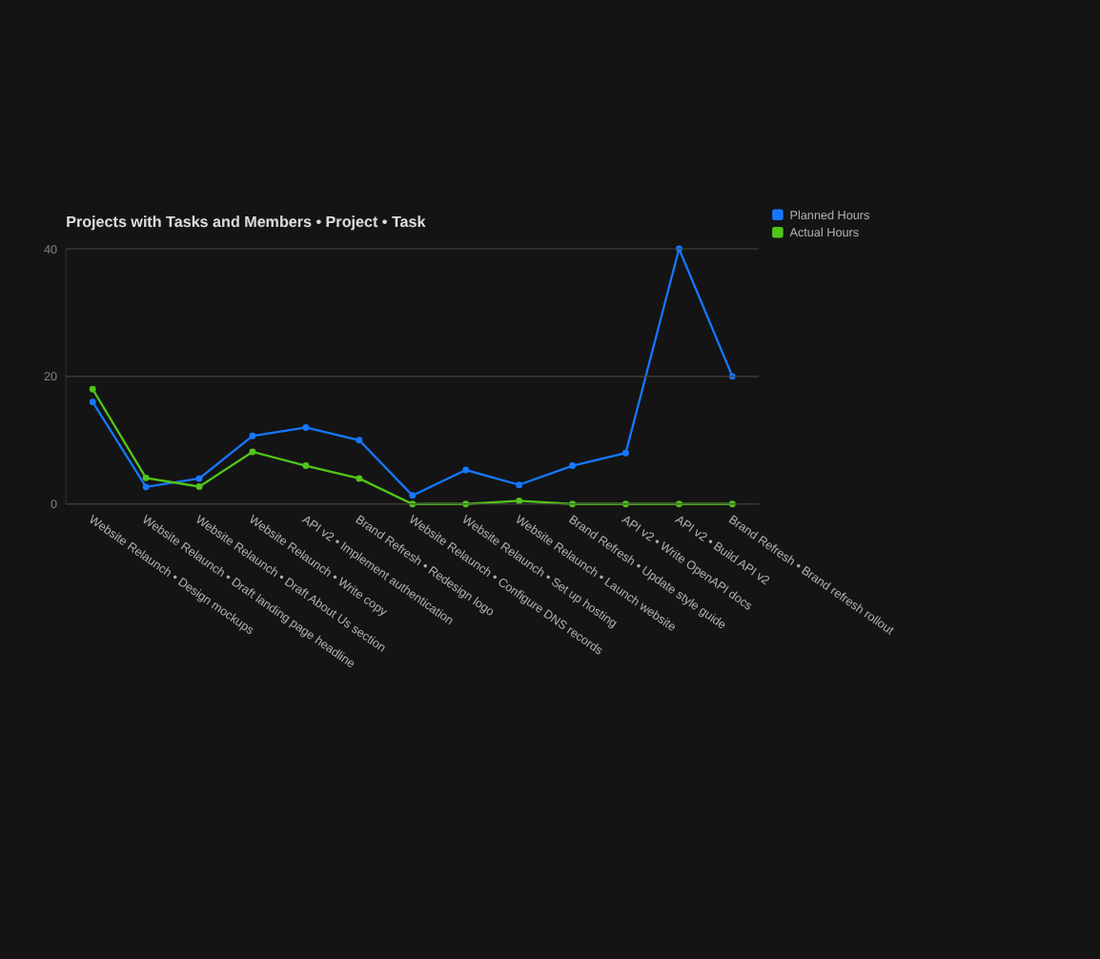
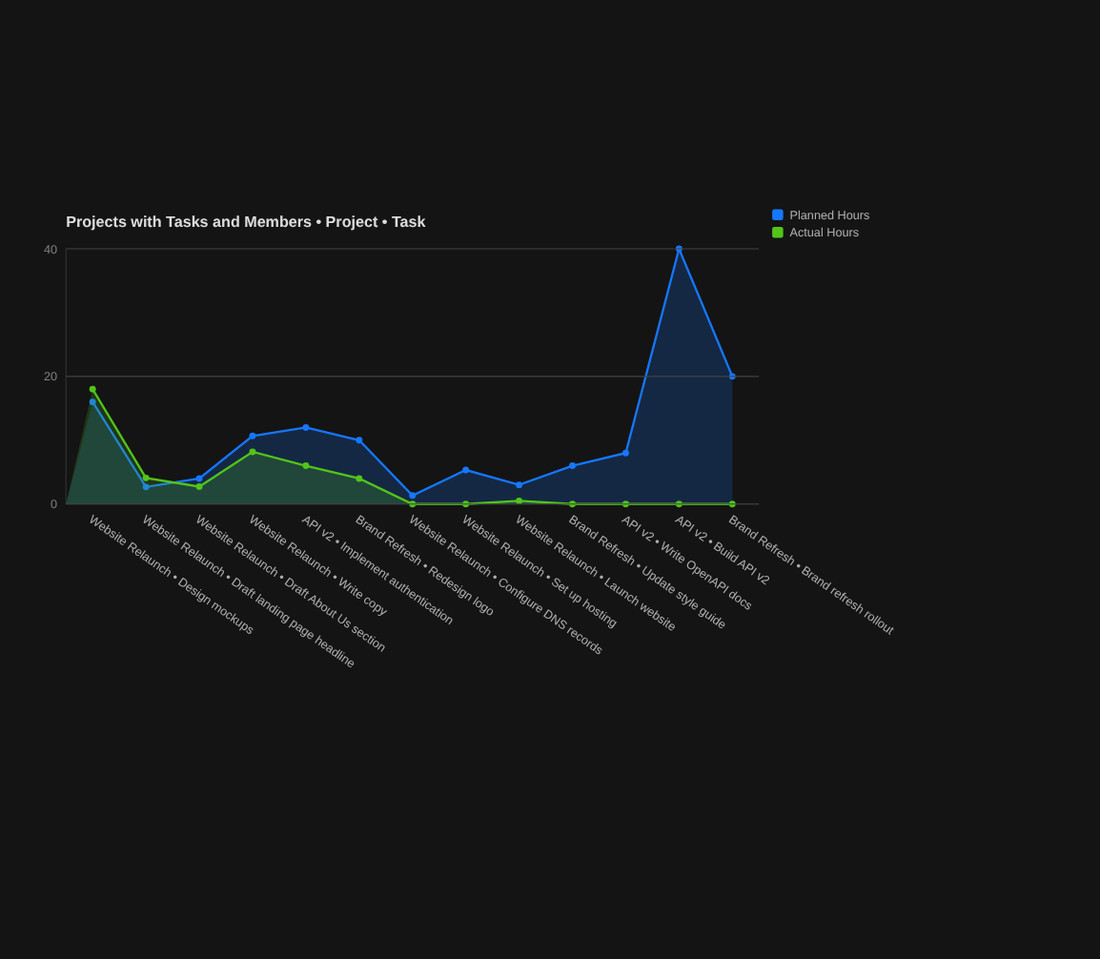
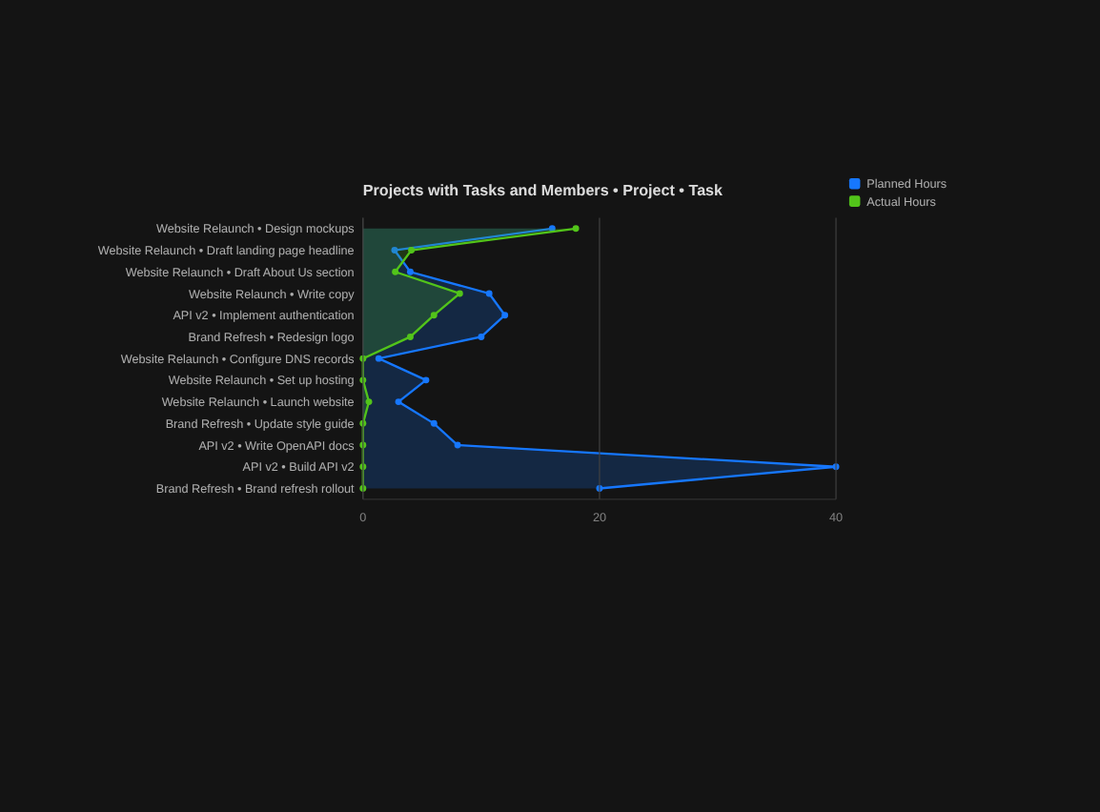
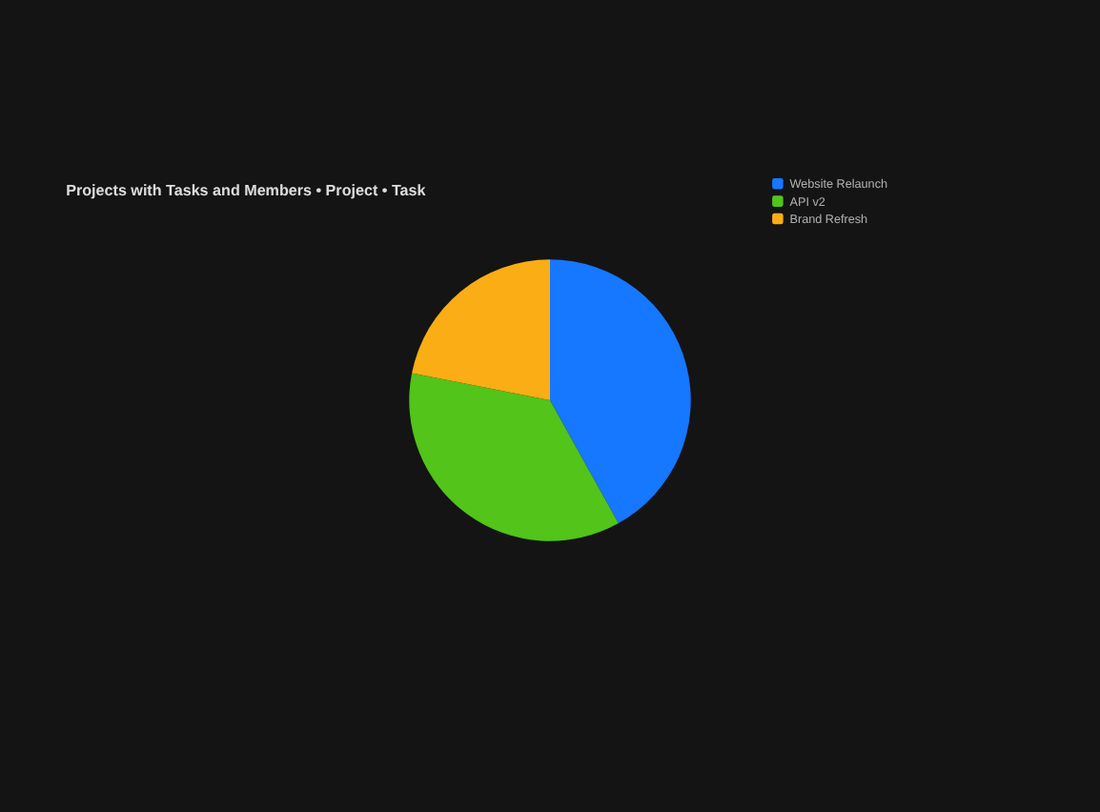
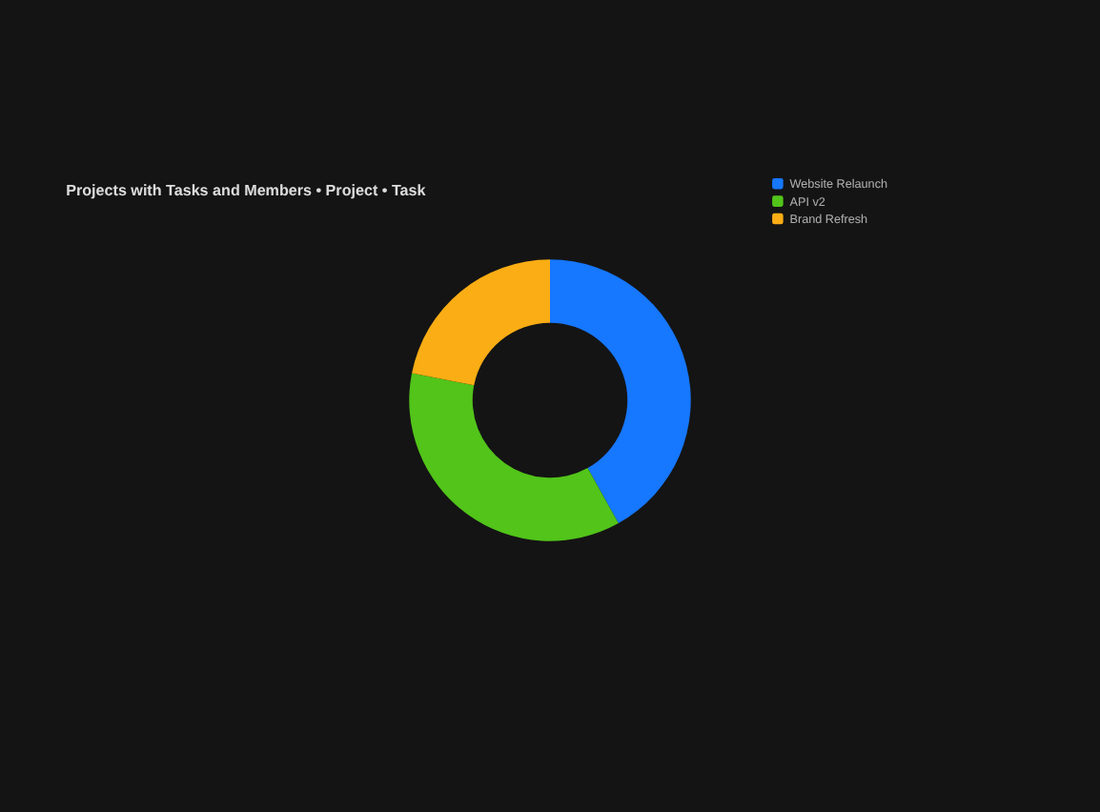
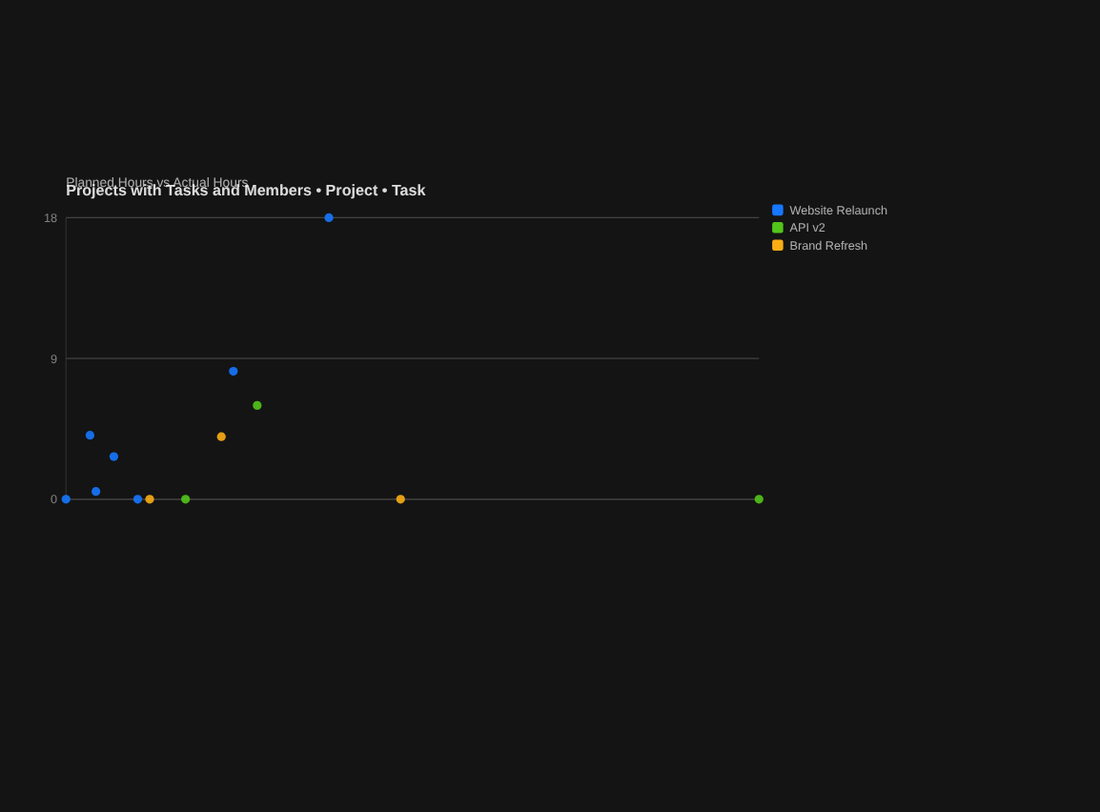
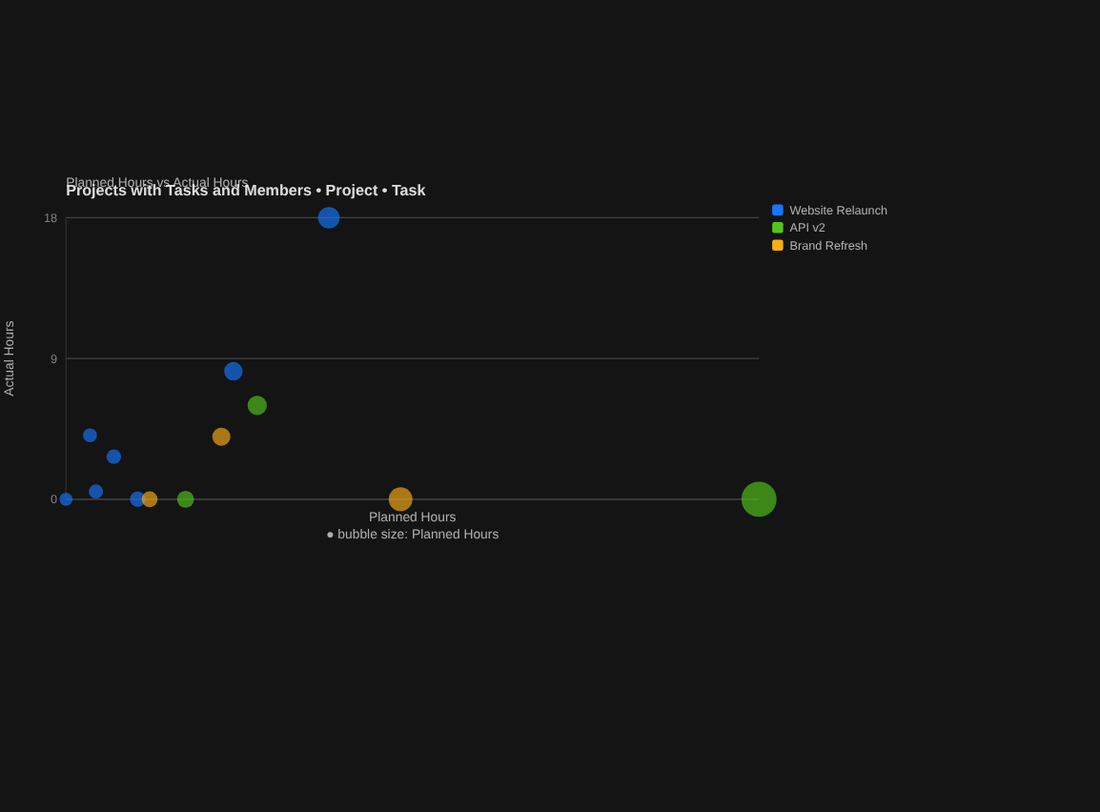
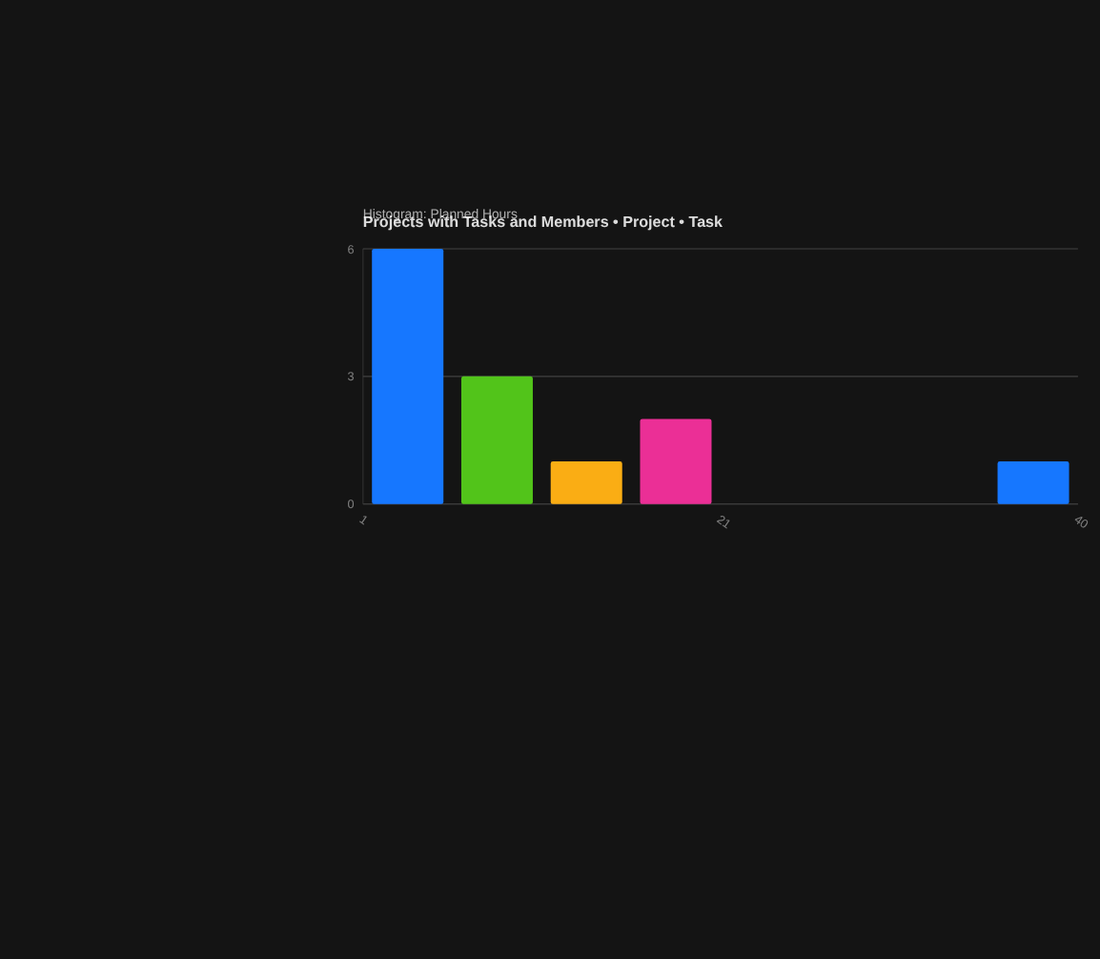
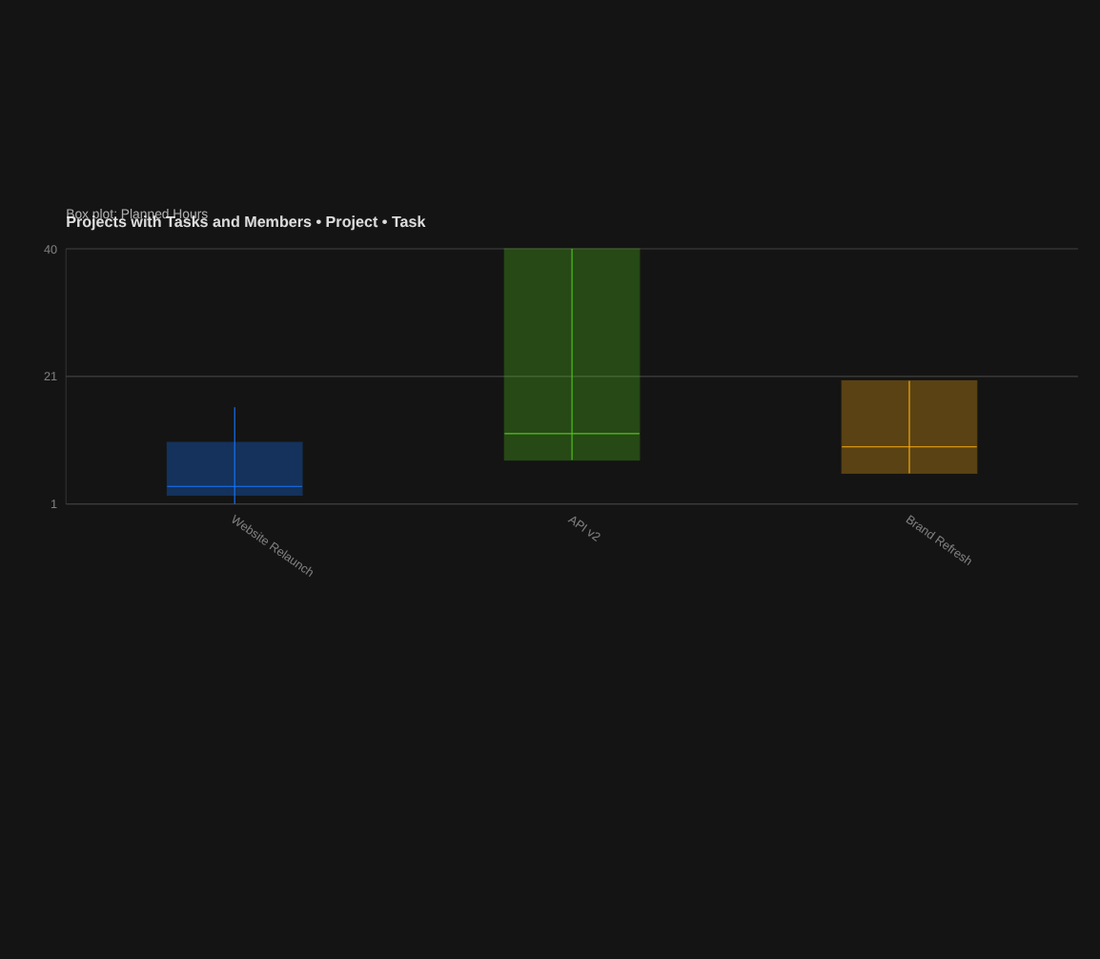
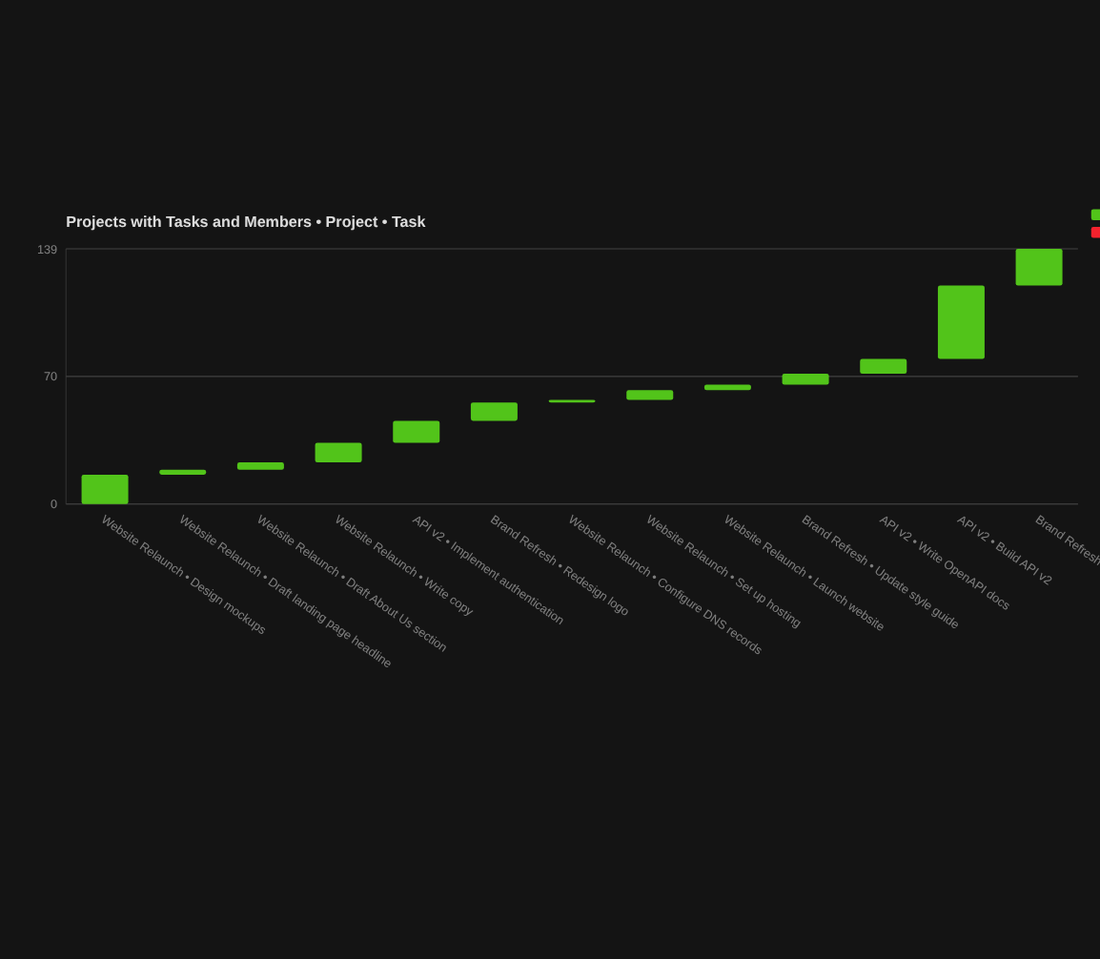
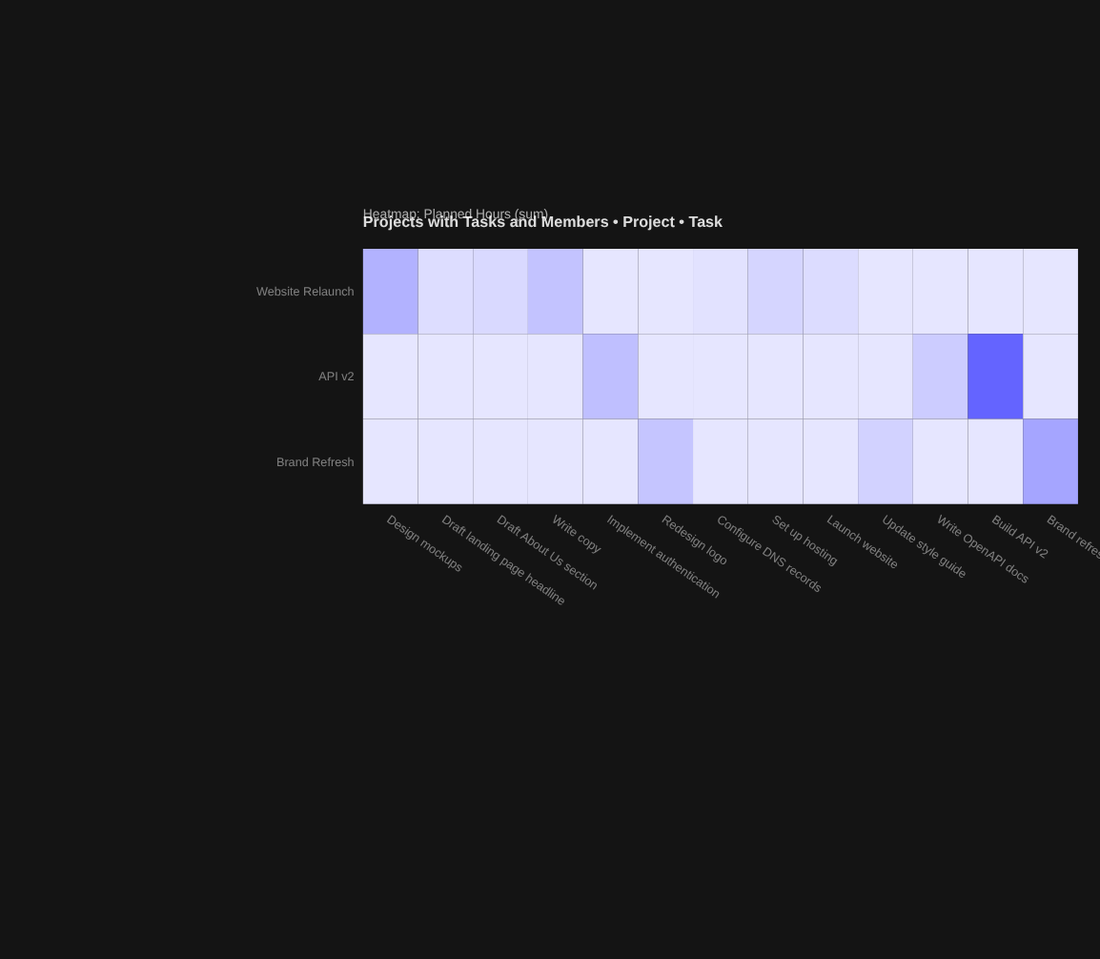
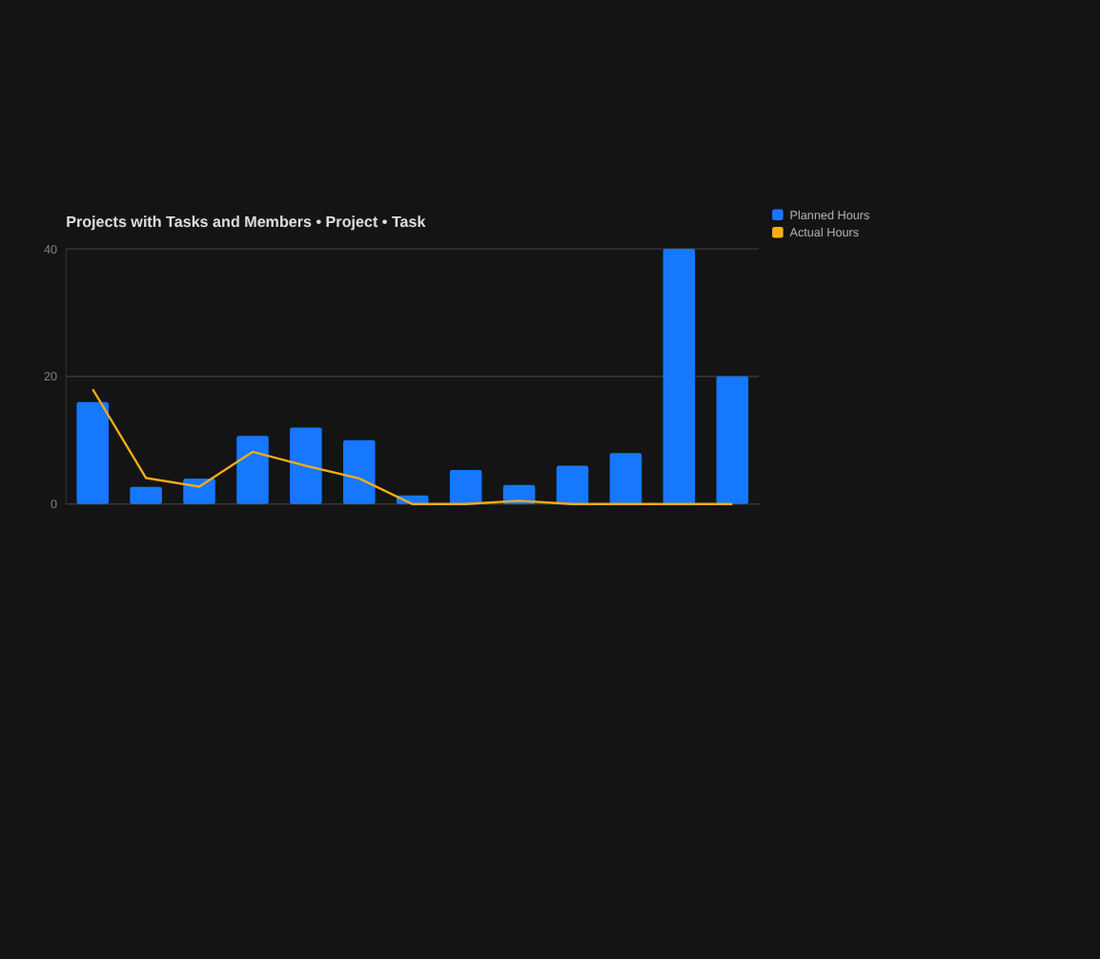
Any list or relation can become a chart. Pick a type, set the axes — no charting library, no glue code.
Bars
Stacked Bars
Horizontal Bars
Horizontal Stacked
Lines
Area
Horizontal Area
Pie
Donut
Scatter
Bubble
Histogram
Box Plot
Waterfall
Heatmap
Crosstab
ComboEvery screen ships in both themes. One toggle, remembered per user — nothing to theme yourself.

The default, tuned for long sessions and dense data.

The same dashboard, one click away — no extra styling.
A browser-based dashboard mounted automatically at /veloiq-studio/ — explore your schema, run scaffolding commands, and inspect your app without touching the terminal.
See Studio scaffold a real app, start to finish, on the homepage →

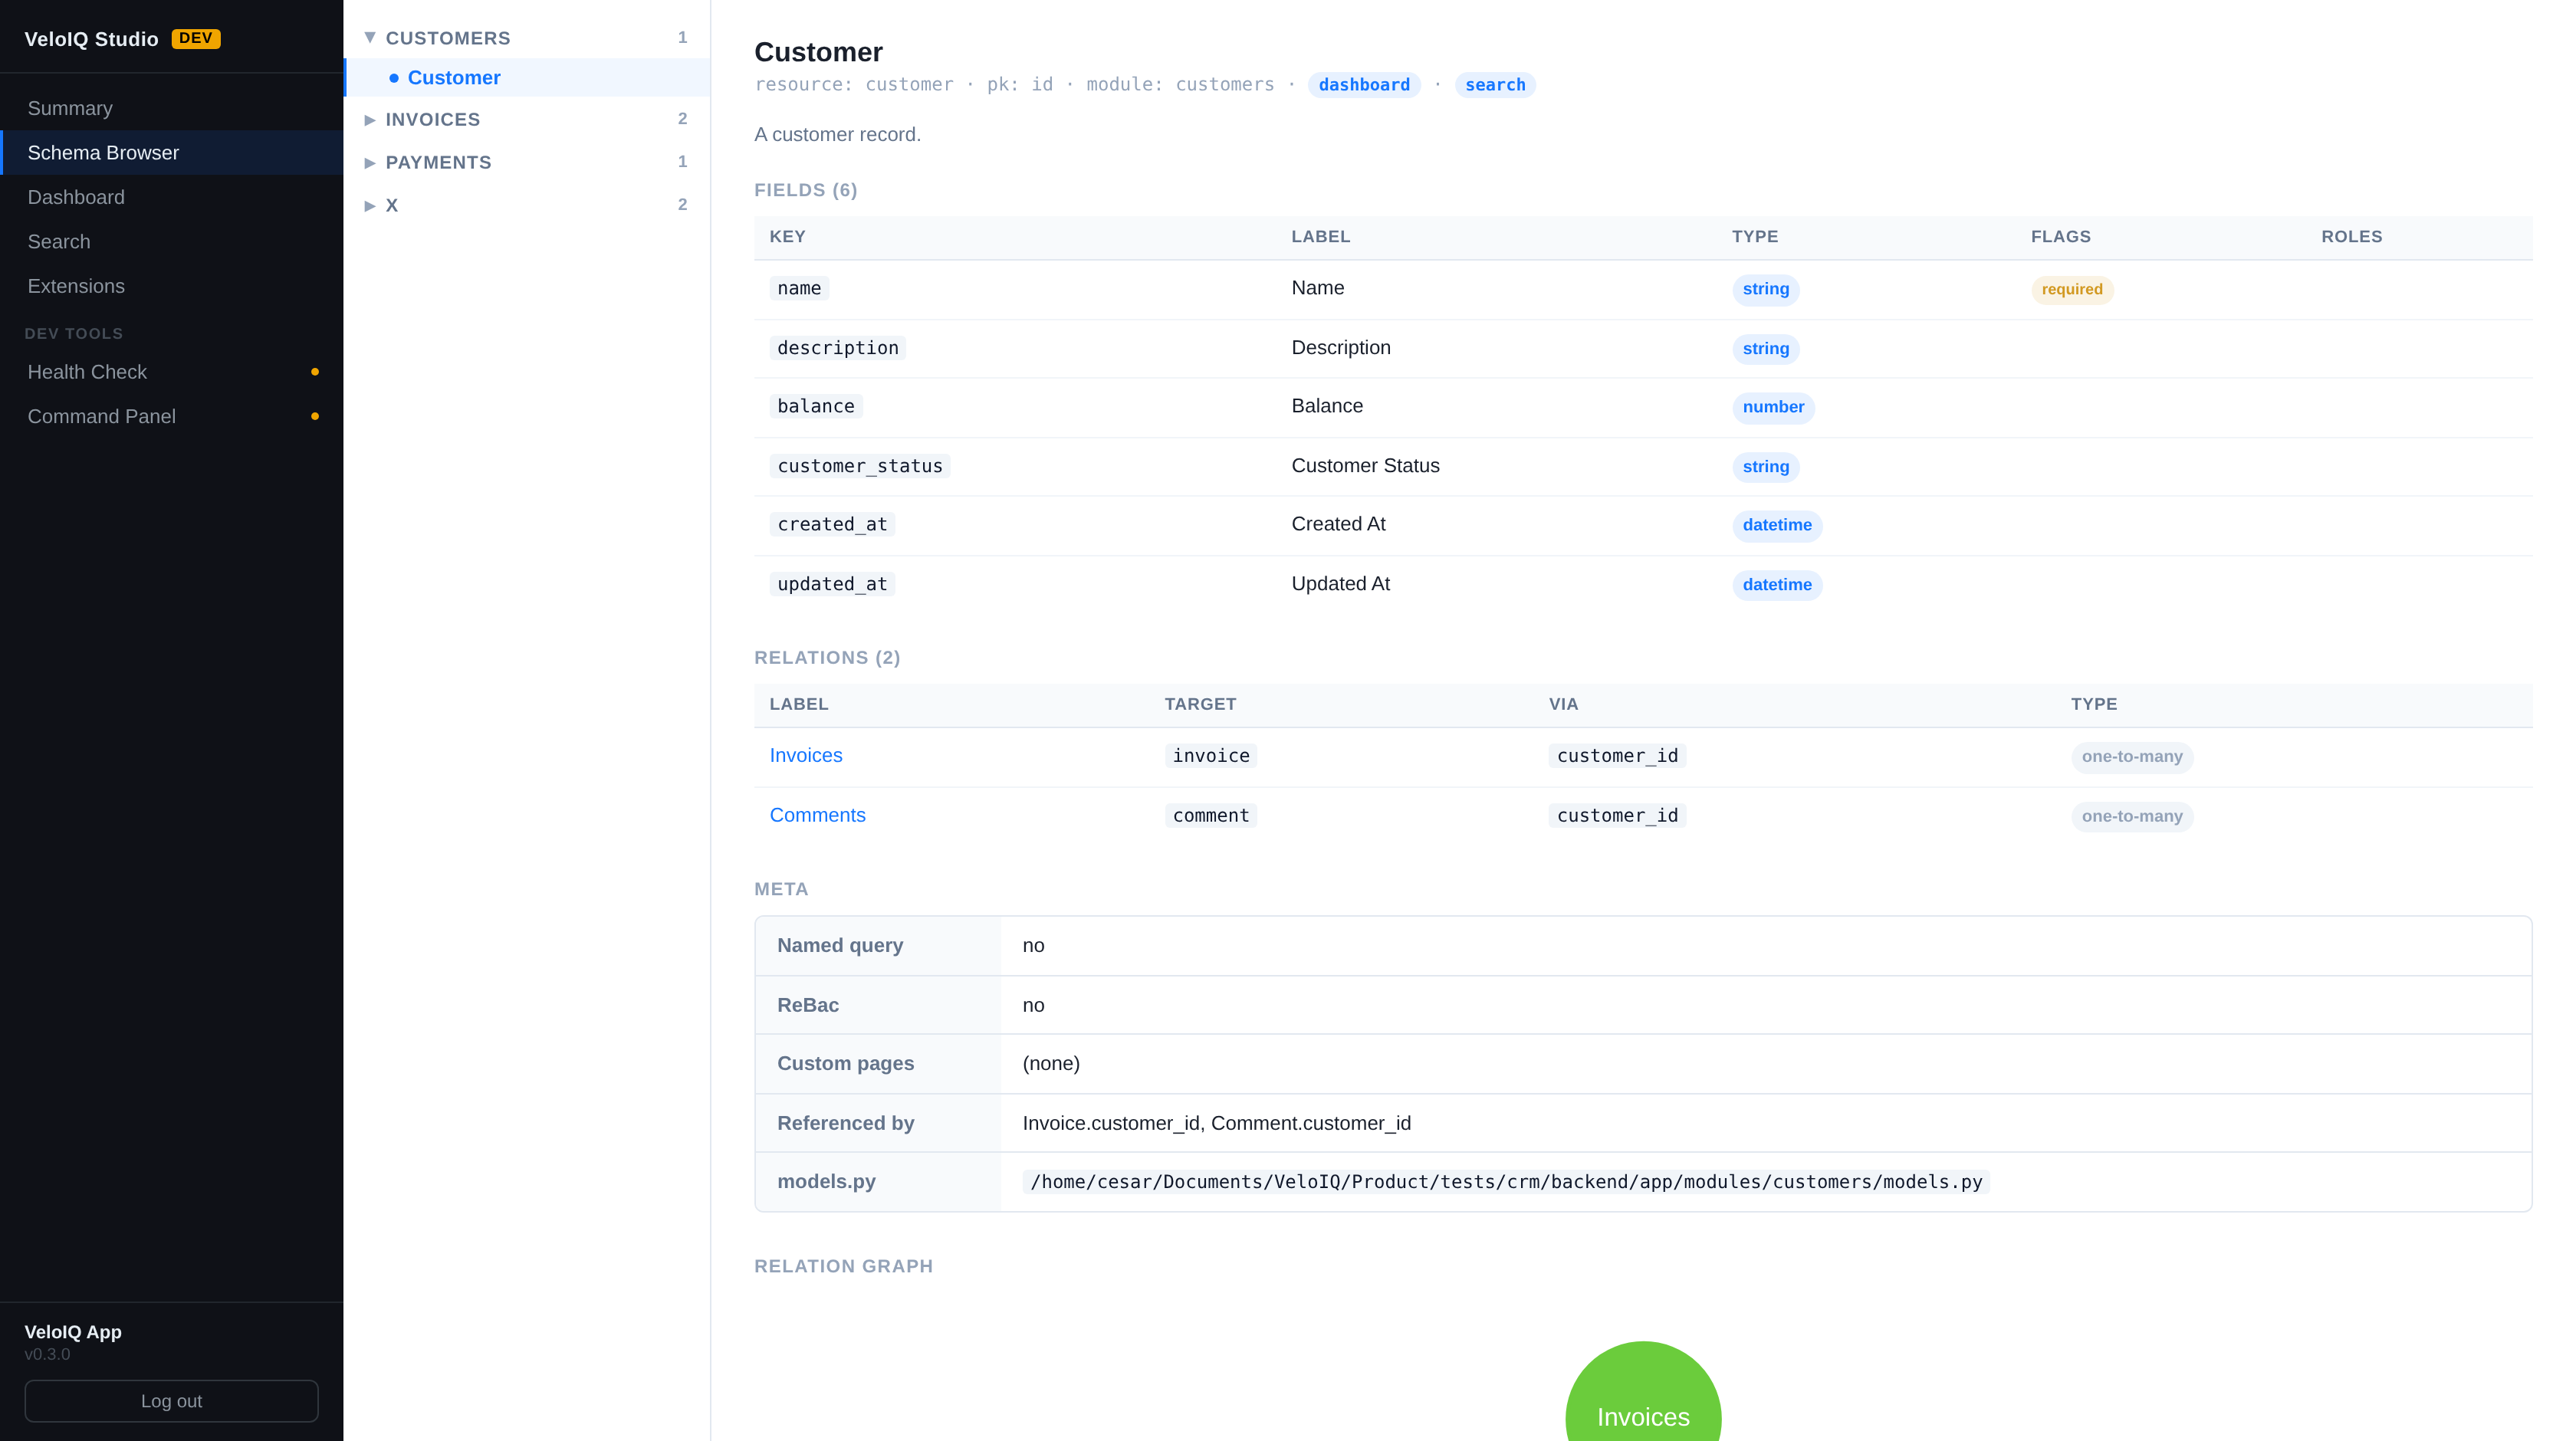
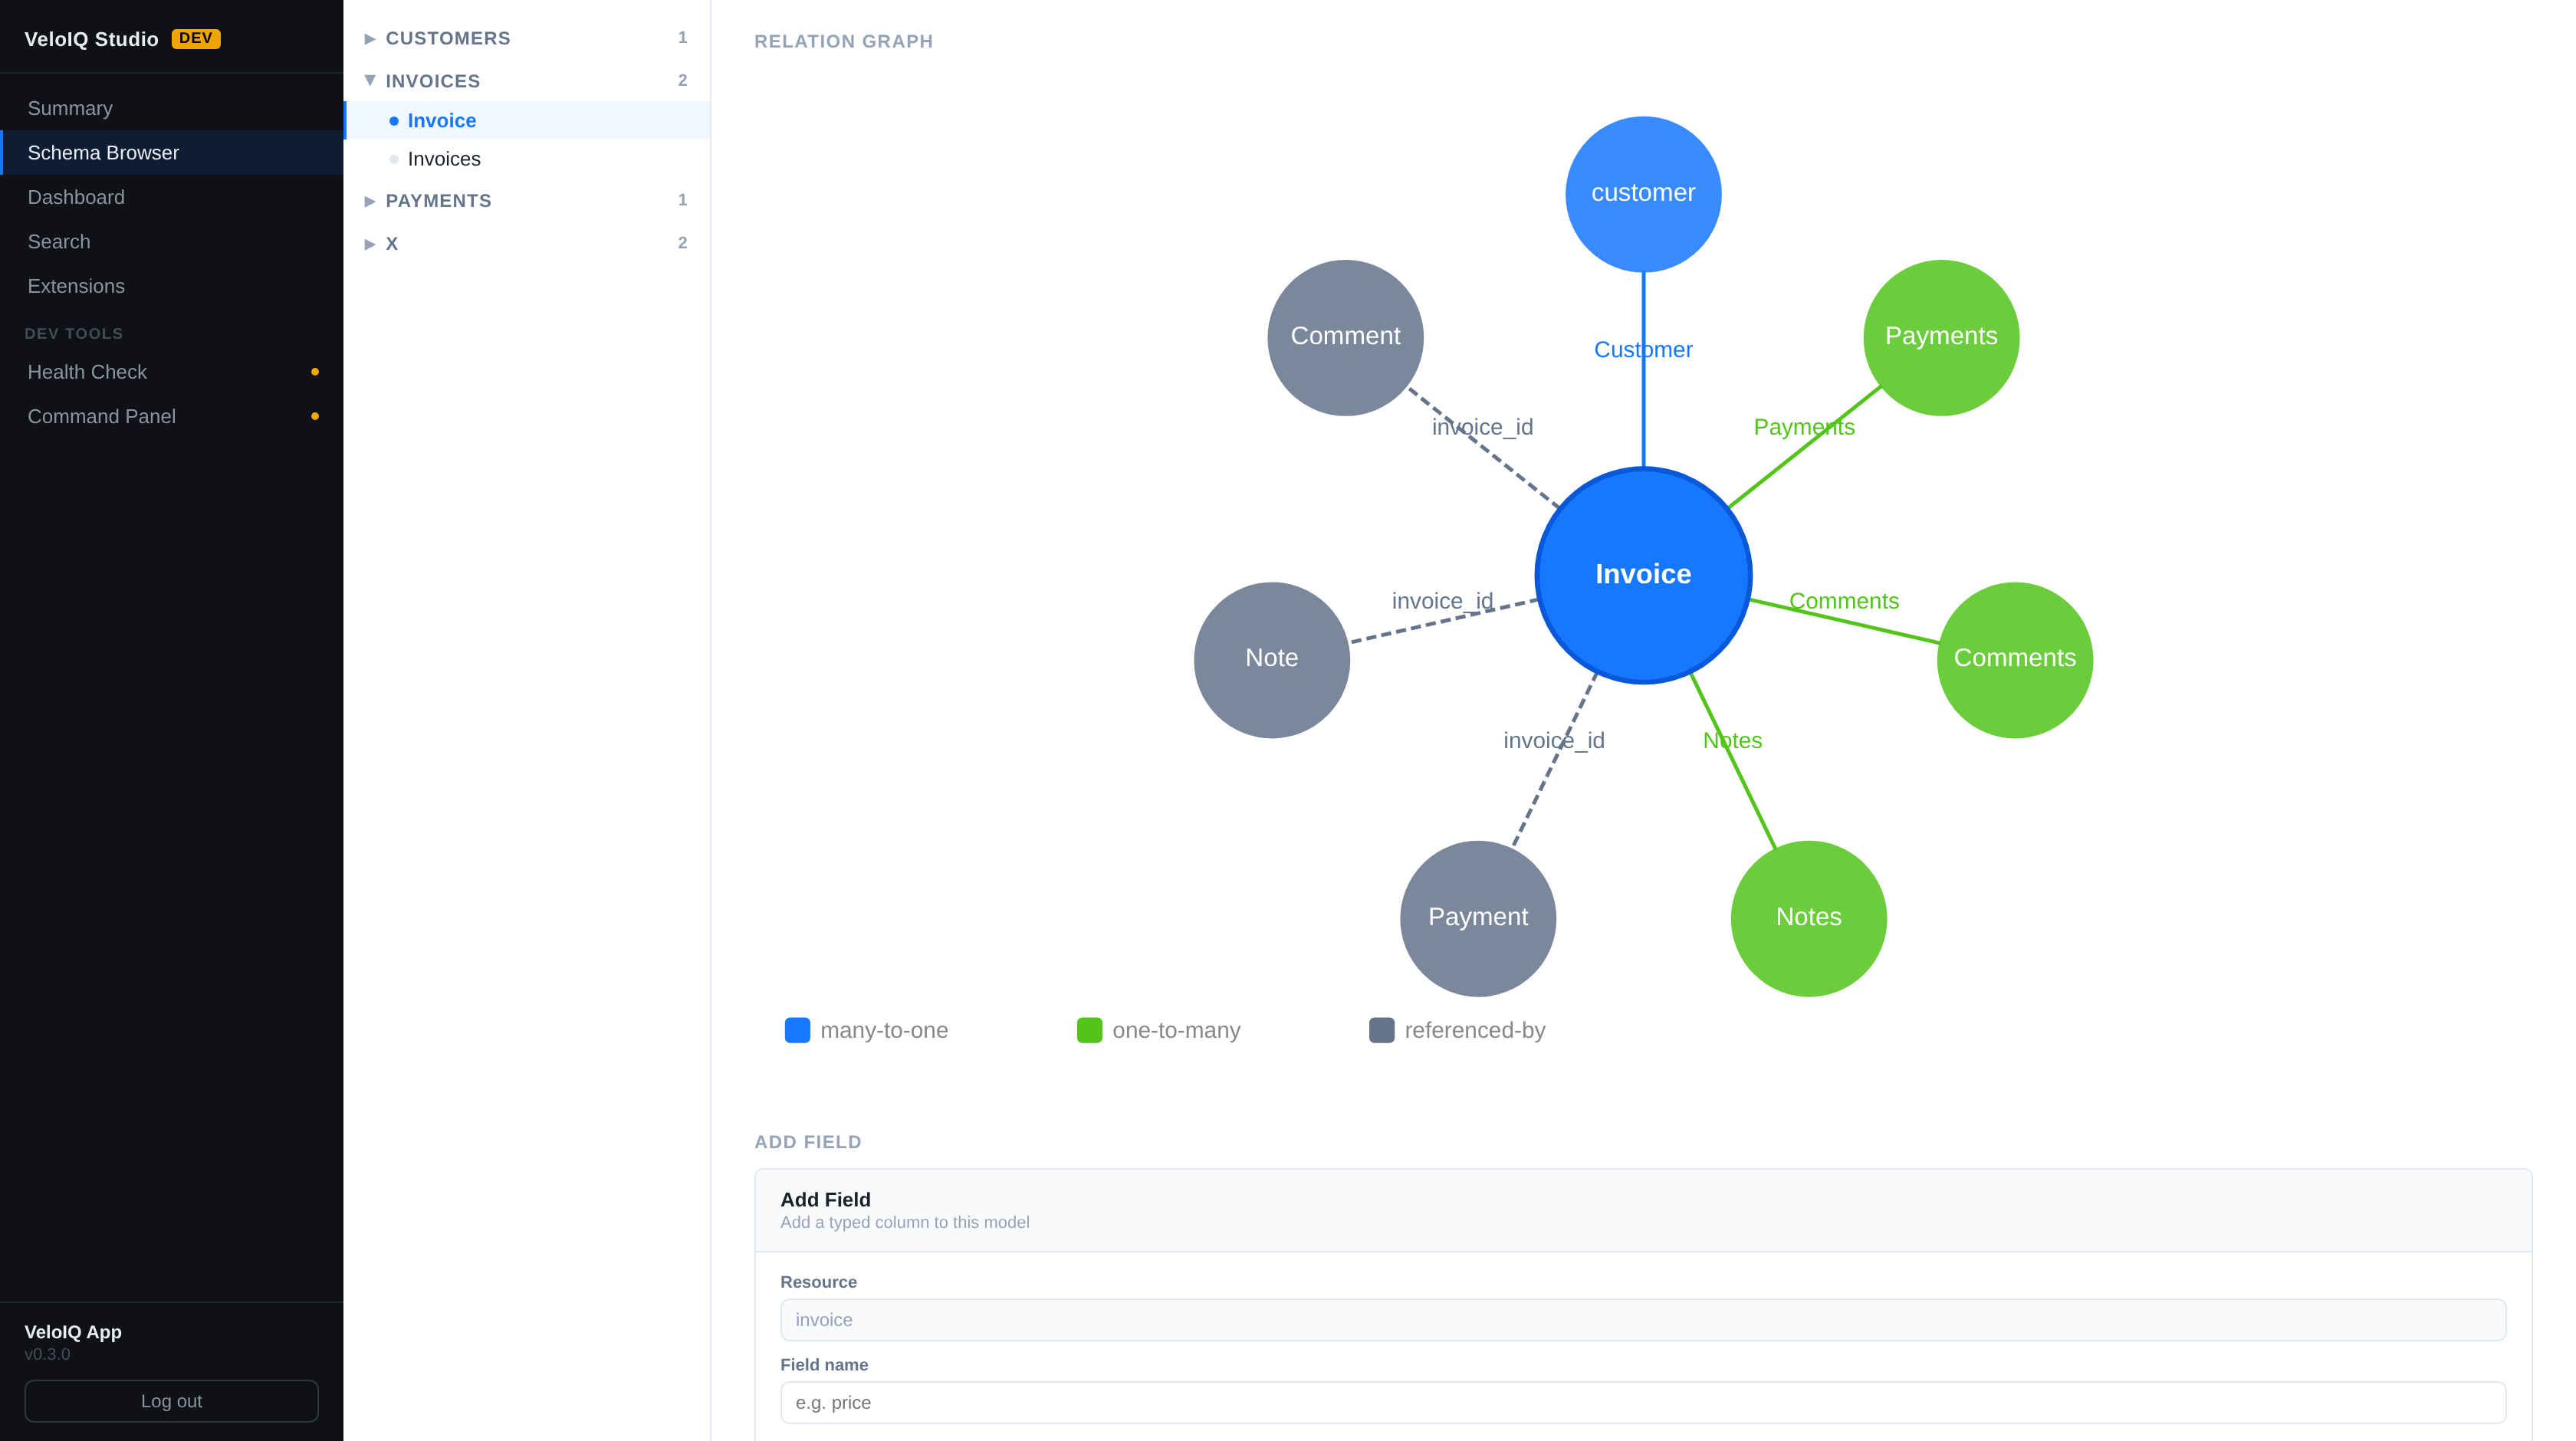
A module/model tree on the left, rich detail on the right — fields, types, flags, and relations for every model in your project. Navigable: click a relation to jump to the target model.

Each model detail page includes an orbit graph of all its relations — forward FK parents, one-to-many children, many-to-many links, and reverse references — colour-coded by type. Click any node to navigate.
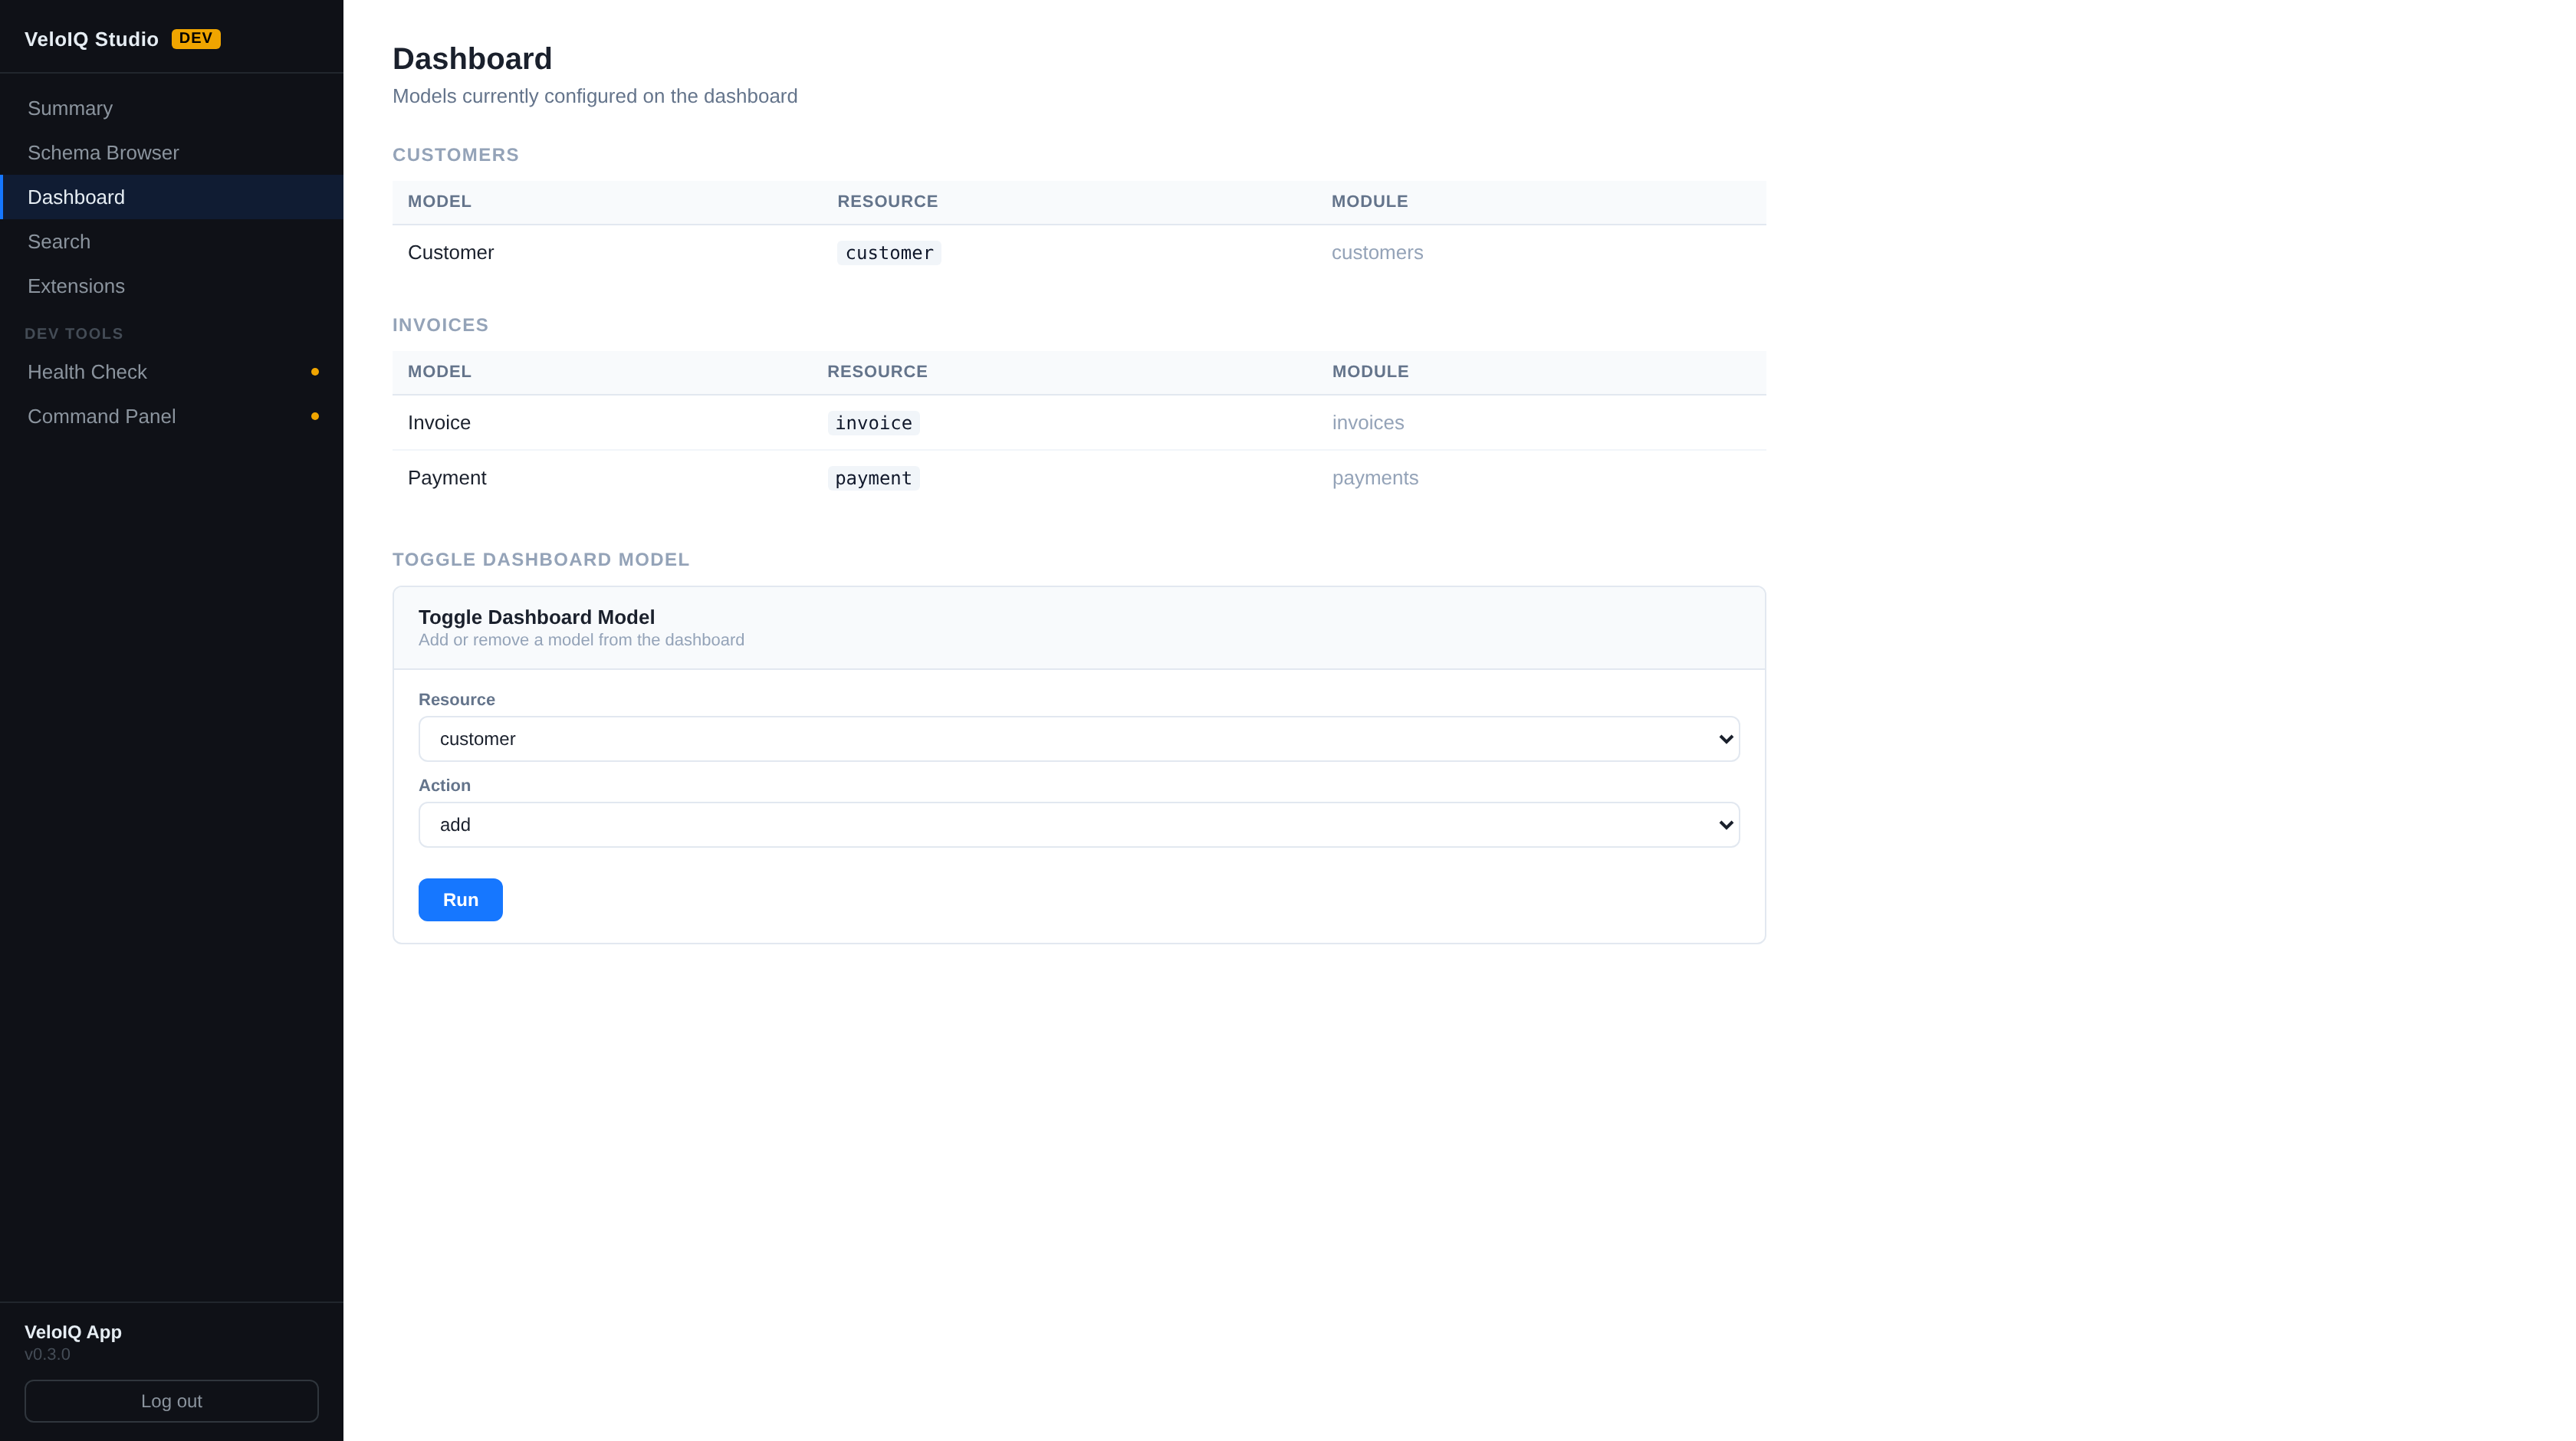
See which models are on the dashboard and which are enrolled in search. In dev mode, toggle them with a single command — no config file edits.

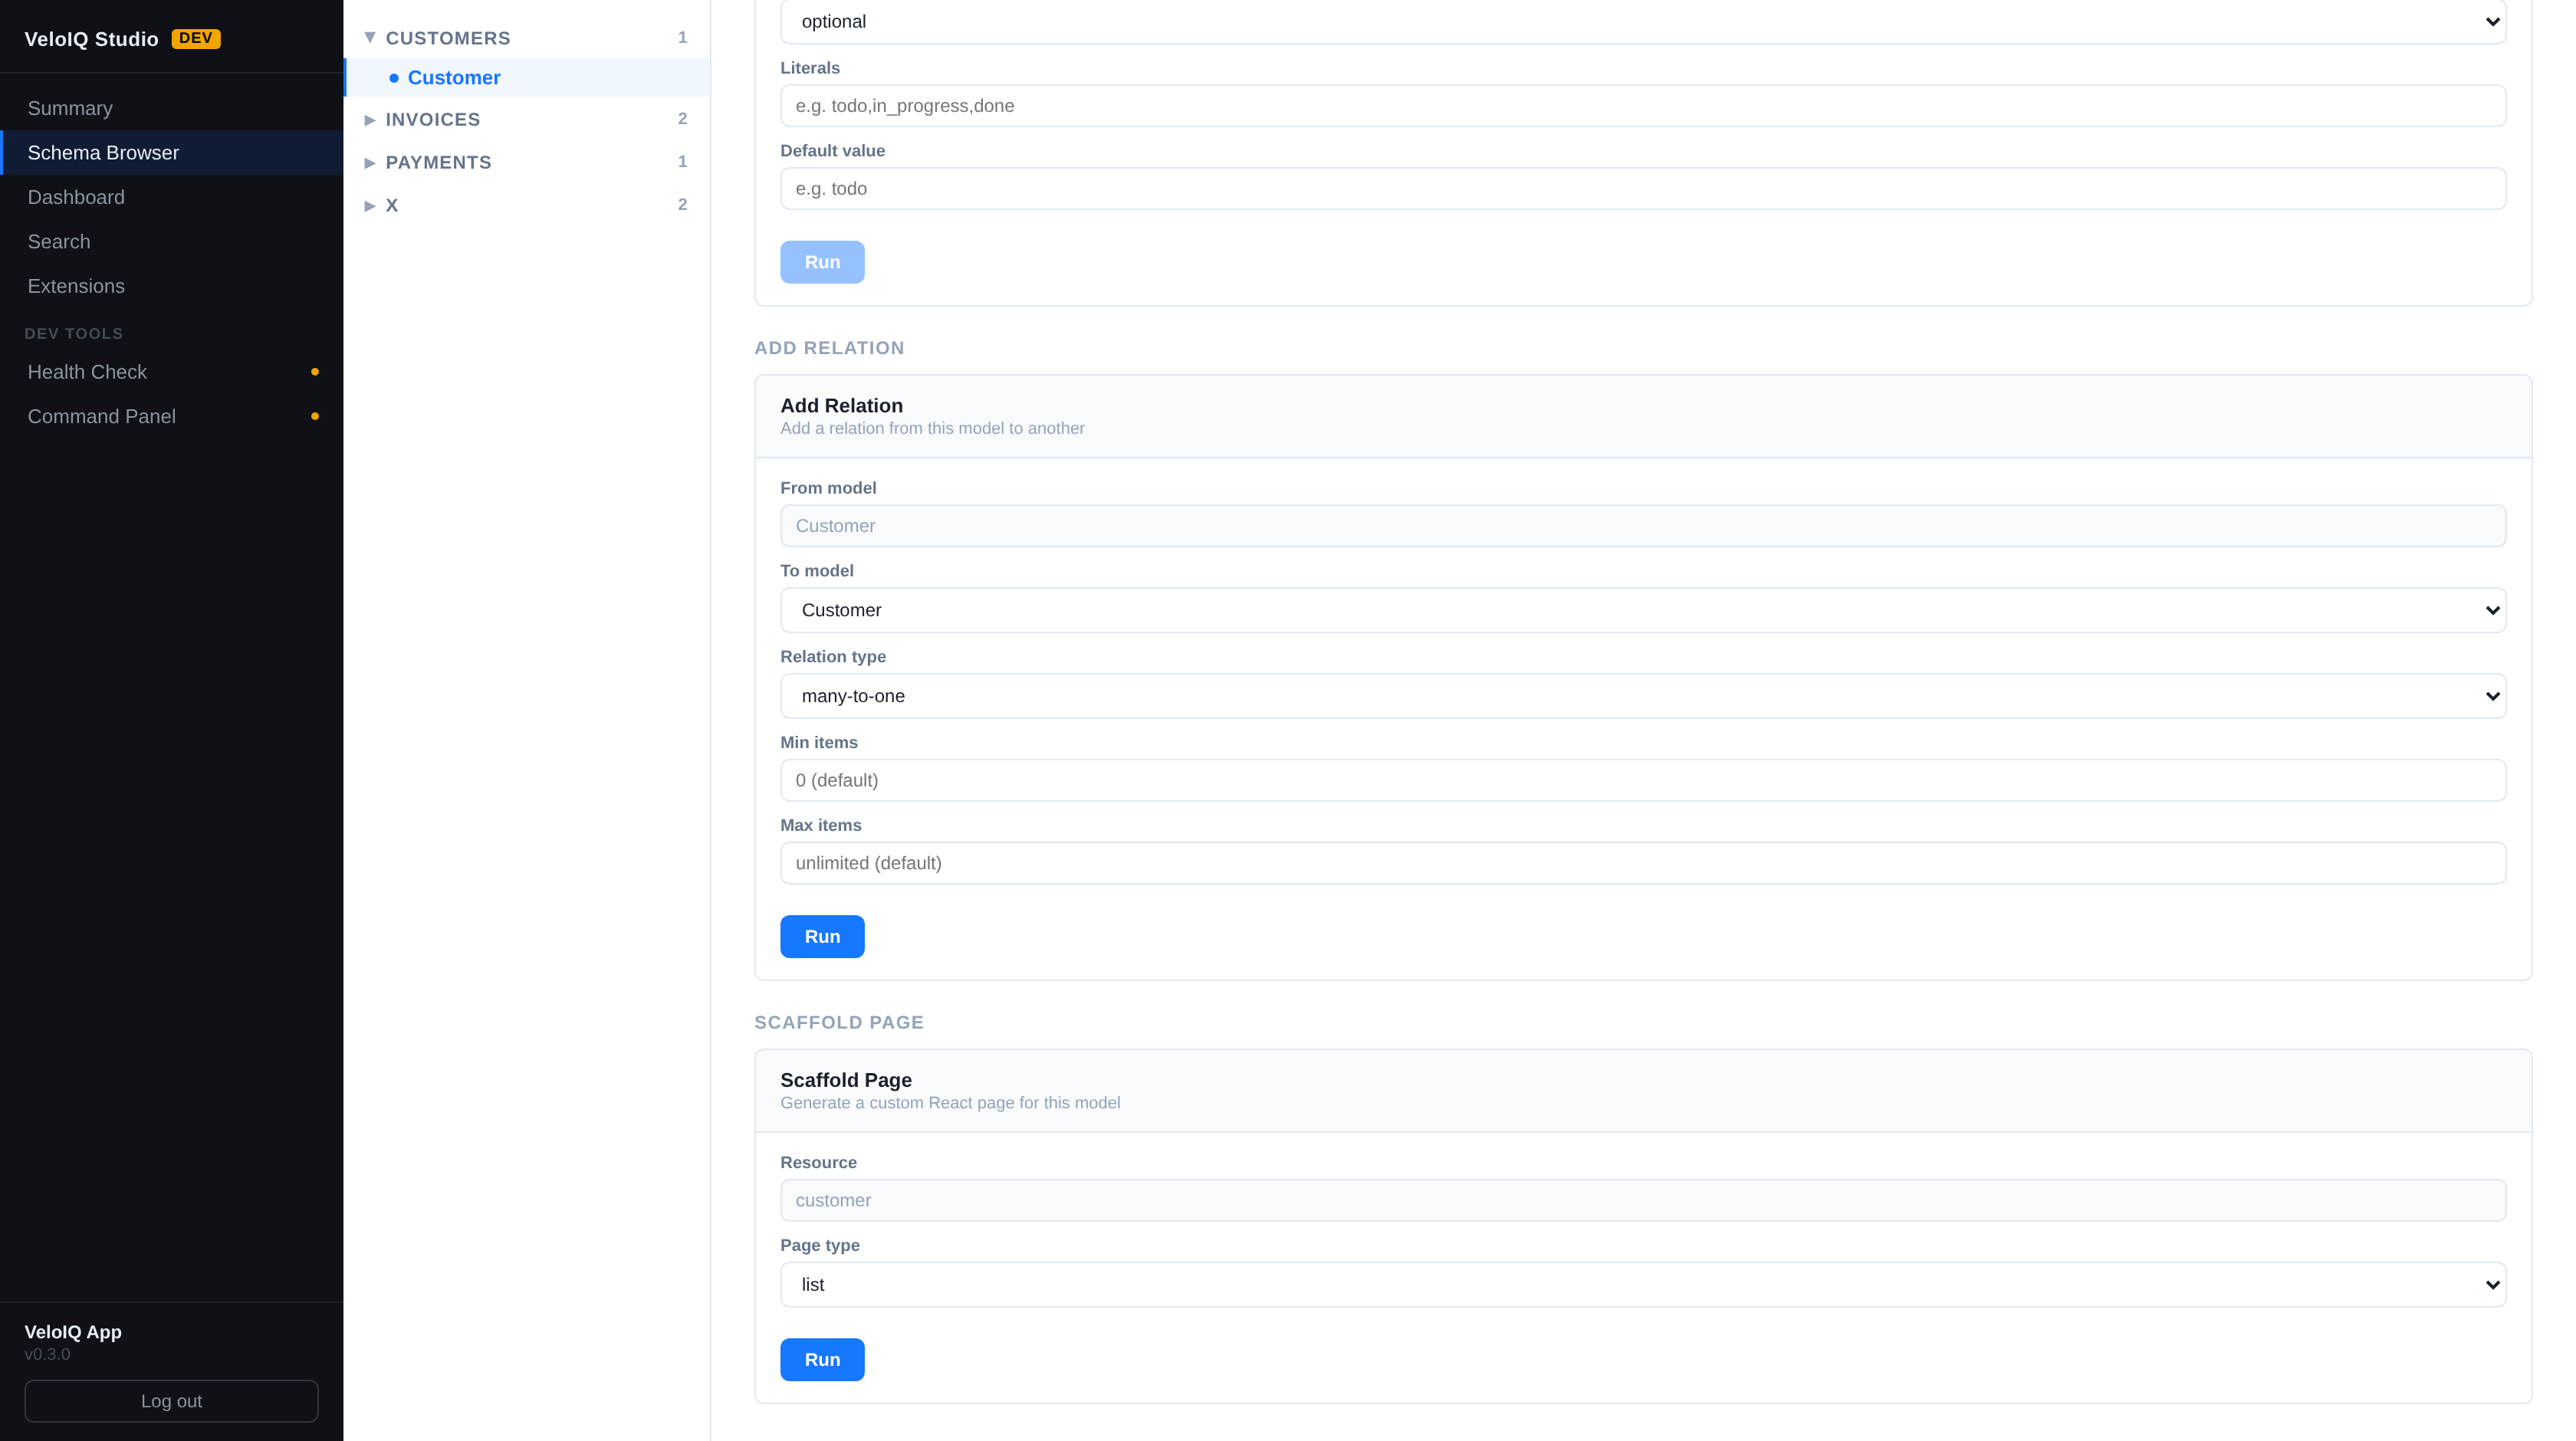
Add Field, Add Relation, and Scaffold Page commands appear pre-filled with the selected model — run veloiq CLI commands without leaving the browser. Output streams live; schema refreshes automatically.

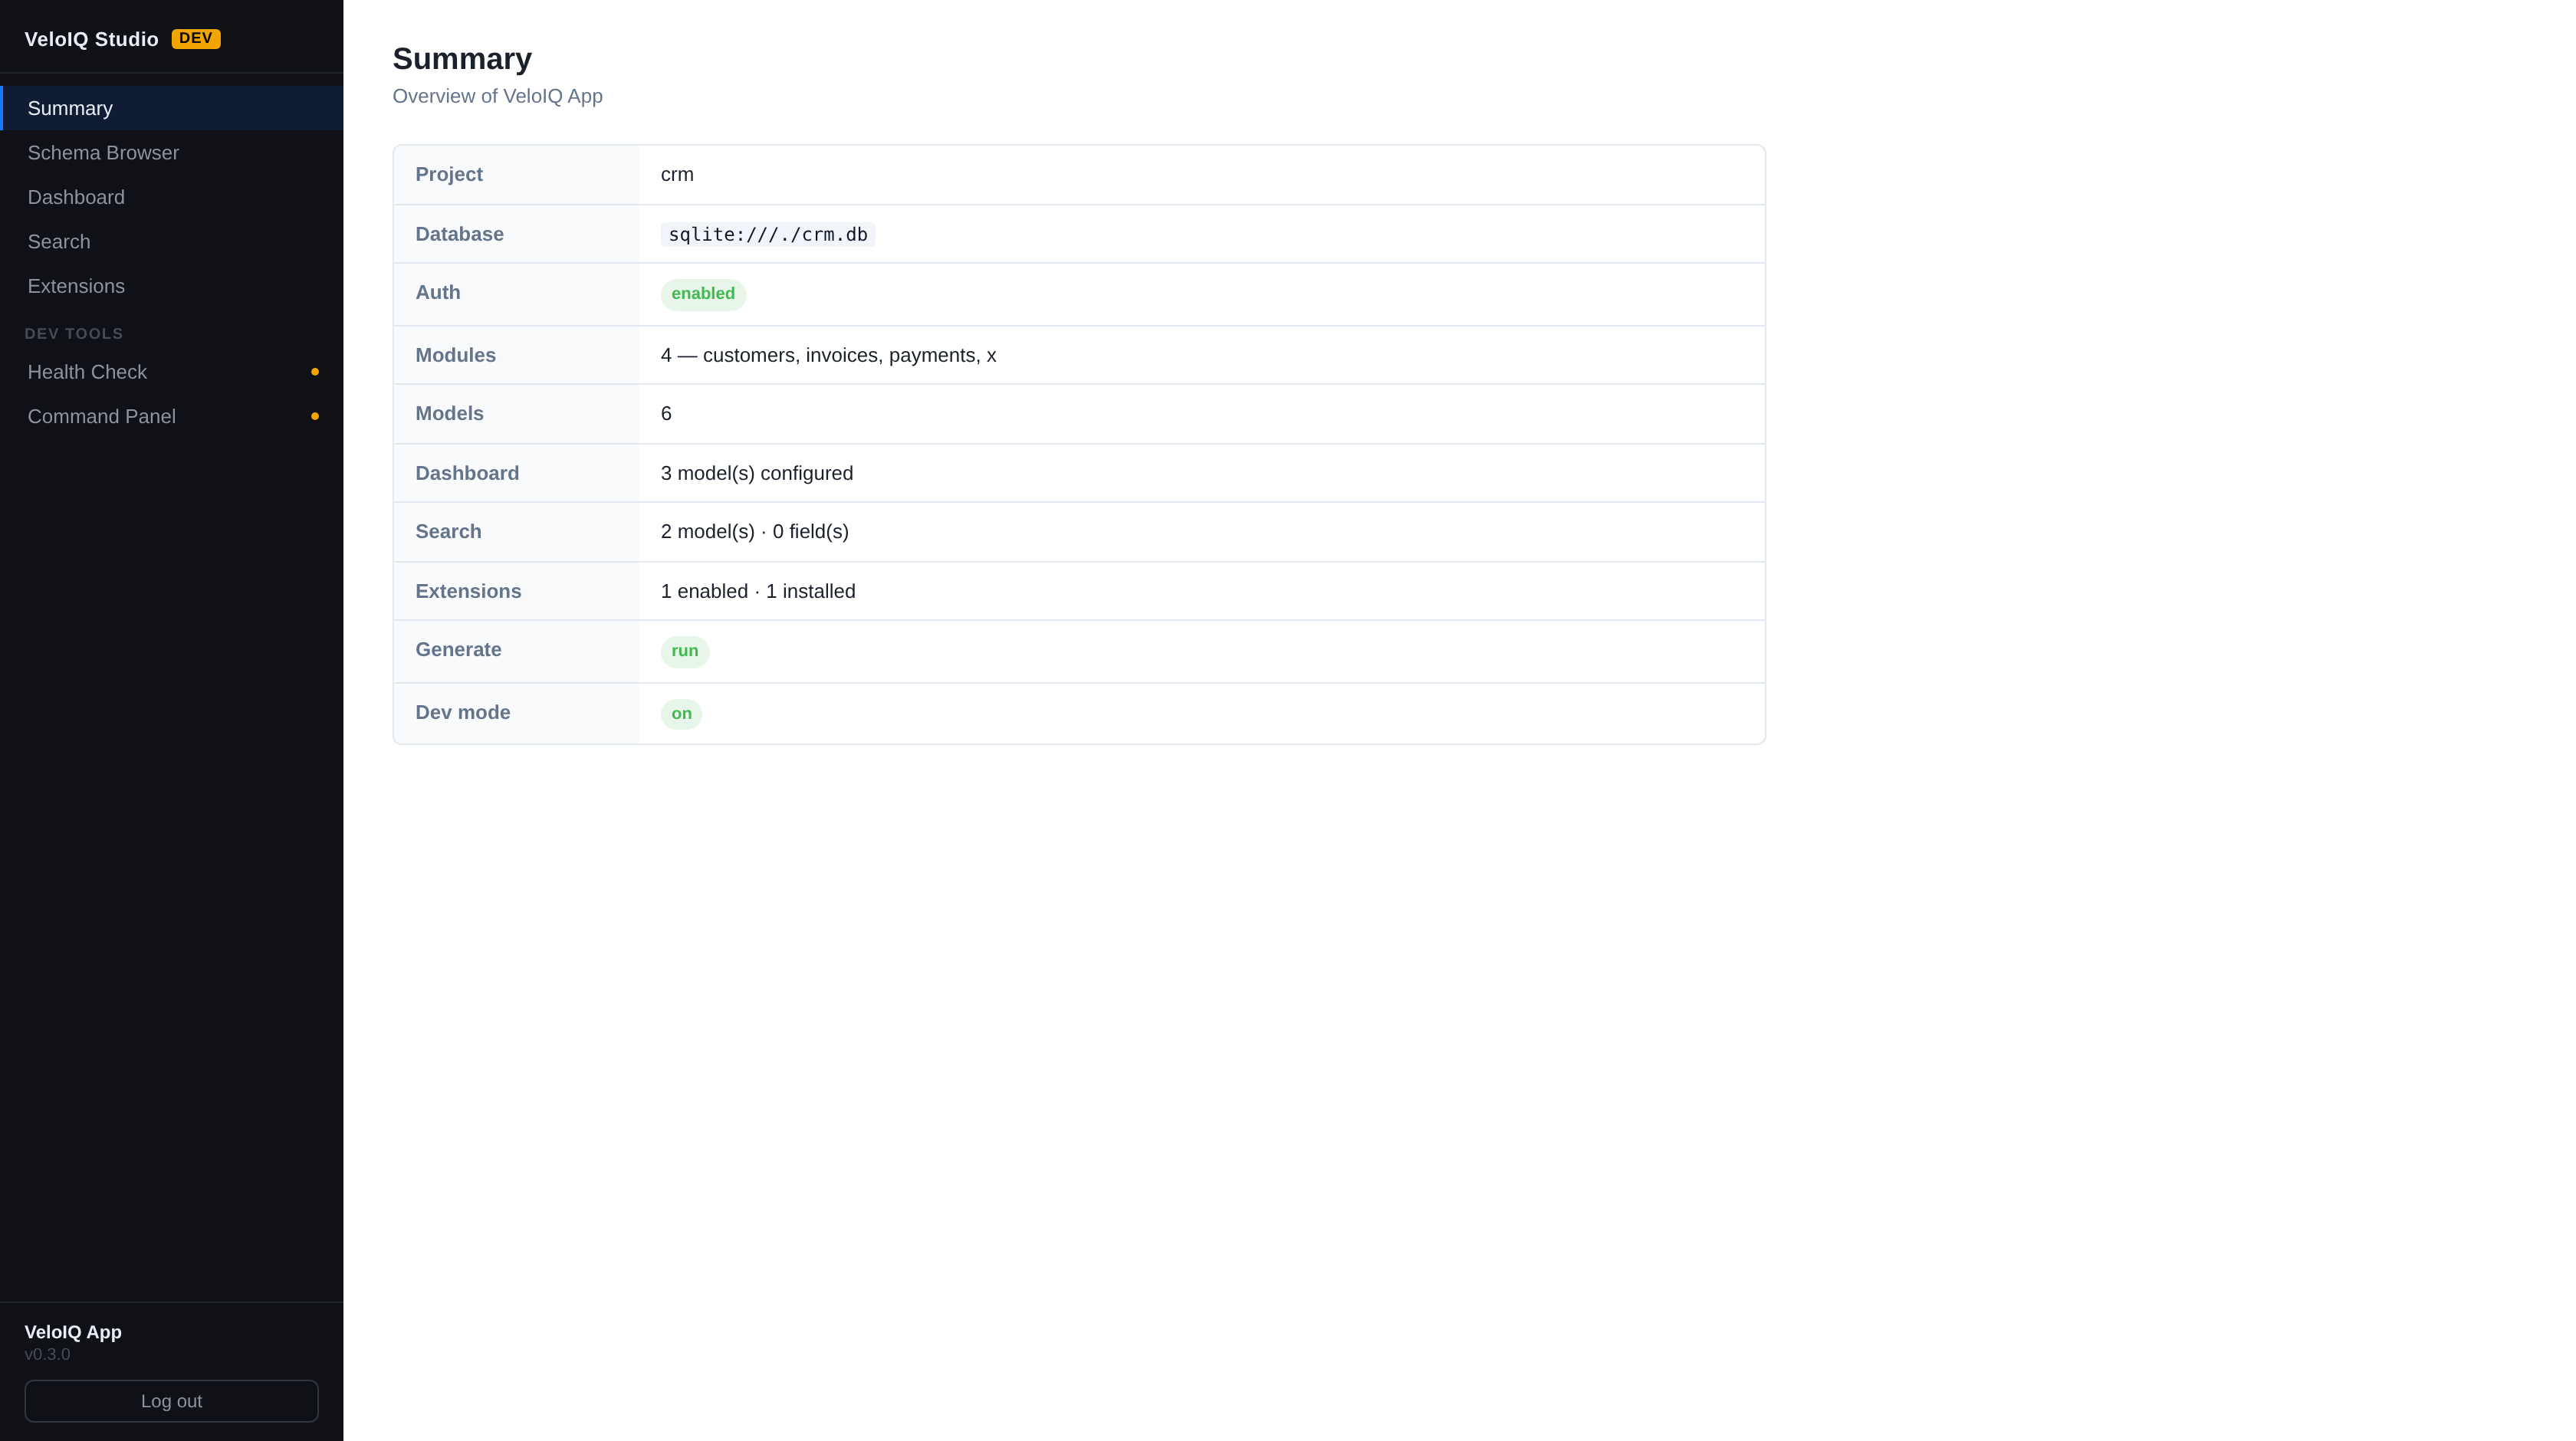
Project name, database URL, module count, dashboard and search enrollment, extensions status, and dev mode flag — the first thing you see when you open the studio.
Clone the repo, run one script, and explore every screen above in your own browser — pre-loaded with sample data.
$ git clone https://github.com/cesarlugos1s/veloiq.git $ cd veloiq $ bash samples/task-manager/quickstart.sh